Bird genomes.

I have been hesitant to talk about the association between bird genome size and flight, even though it has been fluttering around in the blogosphere for some time now (e.g., here and here and here). This may seem counterintuitive, since of all the bloggers interested in the issue, I have actually published articles on the subject. The reason is that a colleague and I have ostensibly been working on a paper about this subject (though it has been on the back burner for a long time) and because I have a student doing research on this issue and I did not feel it appropriate to discuss his unpublished study. But today there is another blog discussion (here and here) about how some dinosaurs already had small genomes and therefore that genome reduction was not part of the evolution of flight in the avian descendants of those dinosaurs. I figure one small clarification is useful.

Modern birds have smaller genomes than the dinosaurs are estimated to have had, strong flyers have the smallest, and flightless birds the largest.

The most reasonable interpretation of this is that genomes began to shrink in saurischian dinosaurs, possibly in association with endothermy, and then they shrank more along with the evolution of powered flight.

____________

References

Gregory, T.R. 2002. A bird’s-eye view of the C-value enigma: genome size, cell size, and metabolic rate in the class Aves. Evolution 56: 121-130.

Gregory, T.R. 2005. Genome size evolution in animals. In: The Evolution of the Genome (ed. T.R. Gregory), pp. 3-87. Elsevier, San Diego.

Organ, C.L., A.M. Shedlock, A. Meade, M. Pagel, and S.V. Edwards. 2007. Origin of avian genome size and structure in non-avian dinosaurs. Nature 446: 180-184.

Zimmer, C. 2007. Jurassic genome. Science 315: 1358-1359.


Bacterial genomes and evolution.

The seminar that I give most often when I am invited to speak at other universities begins with a brief introduction to genomes, sets up some comparisons between bacteria and eukaryotes, and then moves into a short overview of bacterial genome size evolution before spending the remainder of the time on genome size diversity and its importance among animals.

The main things that I have to say about bacterial genomes are:

1) Unlike in eukaryotes, bacterial genome size shows a strong positive relationship with gene number (in other words, bacterial genomes contain little non-coding DNA).

Genome size and gene number in bacteria and archaea.
From Gregory and DeSalle (2005).

2) Bacterial genome sizes do not vary anywhere near as much as those of animals do (on the order of 20-fold versus 7,000-fold).

The diversity of archaeal, bacterial, and eukaryotic genome
sizes as currently known from more than 10,000 species.
From Gregory (2005).

3) The major pattern in bacteria is that, on average, free-living species have larger genomes than parasitic species which in turn have larger genomes than obligate endosymbionts (Mira et al. 2001; Gregory and DeSalle 2005; Ochman and Davalos 2006).

Genome sizes among bacteria with differing lifestyles.
Because genome size is primarily determined by the
number of genes in bacteria, the question to be addressed
is why symbionts have fewer genes in their genomes.
From Gregory and DeSalle (2005).

In order to explain these patterns, it was sometimes argued that some bacteria have small genomes because there is selection for rapid cell division, with larger DNA contents taking longer to replicate and thereby slowing down the cell cycle. However, when Mira et al. (2001) compared doubling time and genome size in bacteria that could be cultured in the lab, they found no significant relationship between them. In other words, selection for small genome size is probably not responsible for the highly compact genomes of some bacteria, even though it seems plausible that, more generally, selection does prevent the accumulation of non-coding DNA to eukaryote levels in bacterial cells.

Mira et al. (2001) suggested a different interpretation that is based on two other major processes in evolution — mutation and genetic drift. In terms of mutation, they pointed out that on the level of individual changes that add or subtract relatively small quantities of DNA — i.e., insertions or deletions, or “indels” — deletions tend to be somewhat larger than insertions. The insertions in this case are separate from the addition of whole genes, which happens often in bacteria through sharing of genes among individuals or even across species (“horizontal gene transfer” or “lateral gene transfer“) or gene duplication.

In bacteria (and eukaryotes) small-scale deletions tend
to involve more base pairs than insertions, creating a
“deletion bias”. Of course, larger insertions such as of
transposable elements or gene duplicates are not part
of this calculation as they add much more DNA at once.
From Mira et al. (2001).

So, on the one hand, there are processes that can add genes (duplication and lateral gene transfer), whereas in the absence of these processes, and if there are no adverse consequences to losing DNA (i.e., there is no selective constraint occurring), genomes should tend to get smaller as a result of this deletion bias. In free-living bacteria, there are many opportunities for gene exchange, with lateral gene transfer adding DNA at an appreciable frequency. Moreover, free-living bacteria tend to occur in astronomical numbers, and elementary population genetics reveals that selection will be strong under such conditions (so that even a mildly deleterious mutation, such as a deletion or disruptive insertion, will probably be lost from the population over time). Finally, free-living bacteria must produce their own protein products, and therefore tend to make use of all their genes, which places selective constraints on changes (including indels) in those sequences.

Endosymbiotic bacteria, especially those that live within the cells of eukaryote hosts, are different in multiple relevant respects. First, they do not regularly encounter other bacteria from whom they can receive genes. Second, they occur in drastically smaller numbers — indeed, they experience a population bottleneck severe enough to shift the balance from selection to drift. Third, they come to rely on some metabolites provided by the host and no longer make use of all their own genes. These factors in combination mean that the selective constraints on many endosymbiont genes are relaxed, and the dominant processes become deletion bias and random drift. Over many generations, endosymbiotic bacteria lose the genes they are not using (and some that are only mildly constrained by selection, such is the strength of drift under such conditions) due to deletion bias, and the end result is highly compact genomes.

The compaction of genomes in endosymbionts can be extreme. The smallest genome known in any cellular organism (except, perhaps, one in Craig Venter‘s lab) is found in the bacterial genus Carsonella, a symbiont that lives within the cells of psyllid insects. It contains only 159,662 base pairs of DNA and 182 genes, some of which overlap (Nakabachi et al. 2006).

Carsonella (dark blue) living within the cells and
around the nucleus (light blue) of a psyllid insect.
From Nakabachi et al. (2006).

In some other bacteria, genes that are not used (including non-functional duplicates) may not be lost for some time and may persist as pseudogenes, just as are observed in large numbers in eukaryote genomes. These tend to undergo additional mutations and to degrade over time but can still be recognized as copies of existing genes. In Mycobacterium leprae, the pathogen that causes leprosy, for example, there are more than 1,100 pseudogenes alongside roughly 1,600 functional genes (Cole et al. 2001). Its genome is about 1 million base pairs smaller than that of its relative M. tuberculosis, but clearly many of the inactive genes have not (yet) been deleted.

The two major influences on bacterial genomes: insertion of
genes by duplication and lateral gene transfer, and the loss
of non-functional sequences by deletion.
From Mira et al. (2001).

It would be nice if this post could end there, having delivered a brief overview of an interesting issue in comparative genomics. Sadly, there is more to say because some anti-evolutionists apparently have begun using the topic in a confused attempt to challenge evolutionary science. In particular, though I note that I have become aware of this only second hand, some creationists apparently have suggested that all bacterial genomes are degrading and therefore that bacteria today are simpler than they were in the past, such that complex structures like flagella could not have evolved from less complicated antecedents.

It should be obvious that not all genomes are necessarily “degrading” just because there is a net deletion bias. For starters, selective constraints prevent essential genes from being lost by this mechanism in most bacteria. Furthermore, there exist well established mechanisms that can add new genes to bacterial genomes, including lateral gene transfer and gene duplication. In fact, the rate of gene duplication seems to be related to genome size in bacteria (Gevers et al. 2004). Also, as Nancy Moran noted in an email, “The most primitive bacteria were certainly simple, but they are not around or at least are not easily identified. Many modern bacteria have large genomes and are very complex.” Finally, the compact genomes of endosymbionts, such as in the aphid symbiont Buchnera aphidicola, tend to be more stable than the genomes of free-living bacteria in terms of larger-scale perturbations such as chromosomal rearrangements (Silva et al. 2003).

Some bacteria, in particular those that have shifted to a
parasitic or endosymbiotic dependence on a eukaryote host,
have undergone genome reductions (green, red) as compared
to inferred ancestral conditions. Nevertheless, many other
species continue to display large genomes (blue).
However, the very earliest bacteria probably began
with small genomes and simple cellular features.
From Ochman (2006).

As with eukaryotes, the genomes of bacteria provide exceptional confirmation of the fact of common descent. Not only do comparative gene sequence analyses shed light on the relatedness of different bacterial lineages and the evolution of features like flagella, but the presence — and loss to varying degrees — of non-functional DNA highlights a strong historical signal.

Given that it is her work that is being misused by anti-evolutionists, it is fitting that Dr. Moran be given the last word:

“It seems to me that the widespread occurrence of degrading genes, which are present in most genomes including those of animals, plants, and bacteria, argues pretty strongly in favor of evolution. They are the molecular equivalent of vestigial organs.”

Quite right.

_____________

References

Cole, S.T., K. Eiglmeier, J. Parkhill, K.D. James, N.R. Thomson, P.R. Wheeler, and et al. 2001. Massive gene decay in the leprosy bacillus. Nature 409: 1007-1011.

Gevers, D., K. Vandepoele, C. Simillion, and Y. Van de Peer. 2004. Gene duplication and biased functional retention of paralogs in bacterial genomes. Trends in Microbiology 12: 148-154.

Gregory, T.R. 2005. Synergy between sequence and size in large-scale genomics. Nature Reviews Genetics 6: 699-708.

Gregory, T.R. and R. DeSalle. 2005. Comparative genomics in prokaryotes. In The Evolution of the Genome, ed. T.R. Gregory. Elsevier, San Diego, pp. 585-675.

Mira, A., H. Ochman, and N.A. Moran. 2001. Deletional bias and the evolution of bacterial genomes. Trends in Genetics 17: 589-596.

Nakabachi, A., A. Yamashita, H. Toh, H. Ishikawa, H.E. Dunbar, N.A. Moran, and M. Hattori. 2006. The 160-kilobase genome of the bacterial endosymbiont Carsonella. Science 314: 267.

Ochman, H. 2006. Genomes on the shrink. Proceedings of the National Academy of Sciences of the USA 102: 11959-11960.

Ochman, H. and L.M. Davalos. 2006. The nature and dynamics of bacterial genomes. Science 311: 1730-1733.

Silva, F.J., A. Latorre, and A. Moya. 2003. Why are the genomes of endosymbiotic bacteria so stable? Trends in Genetics 19: 176-180.

The new smallest genome among animals.

I have seen both some of the largest and smallest genomes among animals (well, I have seen stain bound to their DNA, at least). The largest report remains that of the marbled African lungfish, Protopterus aethiopicus, at a gigantic 132Gb (about 40 times more than humans). Some authors argue that this is an overestimate, but regardless they have huge genomes that are undoubtedly much, much larger than those of any mammal.

Until recently, the smallest animal genome size was reported to occur in some root-knot nematodes of the genus Meloidogyne (~ 30Mb) or perhaps in the placozoan Trichoplax adhaerens (~ 40Mb). I tended to have doubts about the nematode estimates because they were derived using older methodology. However, my colleague Serge Morand and his co-authors now report an even smaller genome in a plant-parasitic nematode based on estimates using modern flow cytometry techniques. In particular, the genome size of Pratylenchus coffeae is estimated at about 19Mb, making it the smallest so far found in a metazoan.


Assuming that the lungfish value is reliable, this extends the overall range of genomes sizes in animals to almost 7,000-fold.

_________

References:

Leroy, S, S. Bouamer, S. Morand, and M. Fargette. 2007. Genome size of plant-parasitic nematodes. Nematology 9: 449-450.

Image from http://nematode.unl.edu/pracoff7.jpg


Worst figure of all.

Larry Moran has provided a good discussion of complexity and genome size, and of the confusions that surround their relationship — rather, their lack of a relationship — to one another [Genome size, complexity, and the C-value paradox]. He links to my earlier story about figures that provide a misleading suggestion of a link between complexity and genome size, and in the process he tops the figure I mentioned [What’s wrong with this figure? see also Genome size and gene number]. In fact, the one he notes is easily the worst one I have ever seen like this, for all kinds of reasons. It is from a 2004 article in Scientific American by John Mattick entitled The hidden genetic program of complex organisms.

Where does one begin? For one thing, humans are vertebrates and vertebrates are chordates, so this is just downright ridiculous. “Invertebrates” is paraphyletic as echinoderms are more closely allied to vertebrates than to other non-vertebrate animals. Some fungi are single-celled, and some people consider unicellular algae to be plants. The X-axis in these figures is never labeled, but the obvious implication is that it represents an increasing scale of “complexity”. It is probably unlabeled because otherwise one would have to provide units of complexity, and I doubt that would be straightforward at all. It certainly would be a challenge to justify ranking humans as more complex than dogs — I can not think of any way that one could defend such a position objectively. The sloping of the bars within taxa suggests that this is meant to imply a relationship between genome size and complexity within groups as well, with the largest genomes (i.e., the most non-coding DNA) found in the most complex organisms. This would negate the goal of placing humans at the extreme, as our genome is average for a mammal and at the lower end of the vertebrate spectrum (some salamanders have 20x more DNA than humans). Indeed, the human datum would accurately be placed roughly below the dog’s ass in this figure if it included a proper sampling of diversity.

__________

Updates:

  • An astute, anonymous, commenter has pointed out a further distortion, namely that the disparate heights of the various organisms causes the eye to artificially exaggerate the differences among the bars.
  • This figure has led to the coining of a new term .


Function, non-function, some function: a brief history of junk DNA.

It is commonly suggested by anti-evolutionists that recent discoveries of function in non-coding DNA support intelligent design and refute “Darwinism”. This misrepresents both the history and the science of this issue. I would like to provide some clarification of both aspects.

When people began estimating genome sizes (amounts of DNA per genome) in the late 1940s and early 1950s, they noticed that this is largely a constant trait within organisms and species. In other words, if you look at nuclei in different tissues within an organism or in different organisms from the same species, the amount of DNA per chromosome set is constant. (There are some interesting exceptions to this, but they were not really known at the time). This observed constancy in DNA amount was taken as evidence that DNA, rather than proteins, is the substance of inheritance.

These early researchers also noted that some “less complex” organisms (e.g., salamanders) possess far more DNA in their nuclei than “more complex” ones (e.g., mammals). This rendered the issue quite complex, because on the one hand DNA was thought to be constant because it’s what genes are made of, and yet the amount of DNA (“C-value”, for “constant”) did not correspond to assumptions about how many genes an organism should have. This (apparently) self-contradictory set of findings became known as the “C-value paradox” in 1971.

This “paradox” was solved with the discovery of non-coding DNA. Because most DNA in eukaryotes does not encode a protein, there is no longer a reason to expect C-value and gene number to be related. Not surprisingly, there was speculation about what role the “extra” DNA might be playing.

In 1972, Susumu Ohno coined the term “junk DNA“. The idea did not come from throwing his hands up and saying “we don’t know what it does so let’s just assume it is useless and call it junk”. He developed the idea based on knowledge about a mechanism by which non-coding DNA accumulates: the duplication and inactivation of genes. “Junk DNA,” as formulated by Ohno, referred to what we now call pseudogenes, which are non-functional from a protein-coding standpoint by definition. Nevertheless, a long list of possible functions for non-coding DNA continued to be proposed in the scientific literature.

In 1979, Gould and Lewontin published their classic “spandrels” paper (Proc. R. Soc. Lond. B 205: 581-598) in which they railed against the apparent tendency of biologists to attribute function to every feature of organisms. In the same vein, Doolittle and Sapienza published a paper in 1980 entitled “Selfish genes, the phenotype paradigm and genome evolution” (Nature 284: 601-603). In it, they argued that there was far too much emphasis on function at the organism level in explanations for the presence of so much non-coding DNA. Instead, they argued, self-replicating sequences (transposable elements) may be there simply because they are good at being there, independent of effects (let alone functions) at the organism level. Many biologists took their point seriously and began thinking about selection at two levels, within the genome and on organismal phenotypes. Meanwhile, functions for non-coding DNA continued to be postulated by other authors.

As the tools of molecular genetics grew increasingly powerful, there was a shift toward close examinations of protein-coding genes in some circles, and something of a divide emerged between researchers interested in particular sequences and others focusing on genome size and other large-scale features. This became apparent when technological advances allowed thoughts of sequencing the entire human genome: a question asked in all seriousness was whether the project should bother with the “junk”.

Of course, there is now a much greater link between genome sequencing and genome size research. For one, you need to know how much DNA is there just to get funding. More importantly, sequence analysis is shedding light on the types of non-coding DNA responsible for the differences in genome size, and non-coding DNA is proving to be at least as interesting as the genic portions.

To summarize,

  • Since the first discussions about DNA amount there have been scientists who argued that most non-coding DNA is functional, others who focused on mechanisms that could lead to more DNA in the absence of function, and yet others who took a position somewhere in the middle. This is still the situation now.
  • Lots of mechanisms are known that can increase the amount of DNA in a genome: gene duplication and pseudogenization, duplicative transposition, replication slippage, unequal crossing-over, aneuploidy, and polyploidy. By themselves, these could lead to increases in DNA content independent of benefits for the organism, or even despite small detrimental impacts, which is why non-function is a reasonable null hypothesis.
  • Evidence currently available suggests that about 5% of the human genome is functional. The least conservative guesses put the possible total at about 20%. The human genome is mid-sized for an animal, which means that most likely a smaller percentage than this is functional in other genomes. None of the discoveries suggest that all (or even more than a minor percentage) of non-coding DNA is functional, and the corollary is that there is indirect evidence that most of it is not.
  • Identification of function is done by evolutionary biologists and genome researchers using an explicit evolutionary framework. One of the best indications of function that we have for non-coding DNA is to find parts of it conserved among species. This suggests that changes to the sequence have been selected against over long stretches of time because those regions play a significant role. Obviously you can not talk about evolutionarily conserved DNA without evolutionary change.
  • Examples of transposable elements acquiring function represent co-option. This is the same phenomenon that is involved in the evolution of complex features like eyes and flagella. In particular, co-option of TEs appears to have happened in the evolution of the vertebrate immune system. Again, this makes no sense in the absence of an evolutionary scenario.
  • Most transposable elements do not appear to be functional at the organism level. In humans, most are inactive molecular fossils. Some are active, however, and can cause all manner of diseases through their insertions. To repeat: some transposons are functional, some are clearly deleterious, and most probably remain more or less neutral.
  • Any suggestions that all non-coding DNA is functional must explain why an onion needs five times more of it than you do. So far, none of the proposed unilateral functions has done this. It therefore remains most reasonable to take a pluralistic approach in which only some non-coding elements are functional for organisms.

I realize that this will have no effect on the arguments made by anti-evolutionists, but I hope it at least clarifies the issue for readers who are interested in the actual science involved and its historical development.


Junk DNA gets Wired.

There is a new article on the Wired website about junk DNA [One Scientist’s Junk Is a Creationist’s Treasure]. I make a very brief appearance in it, and I just want to clarify what I meant by the statement cited (I’m still learning that even an hour-long interview might result in only a short blurb).

My quote is “Function at the organism level is something that requires evidence”. I make this statement because there are several different sorts of DNA sequences in the genome whose presence can be explained even if they do not benefit (and indeed, even if they slightly harm) the organism carrying them. Pseudogenes, satellite DNA, transposable elements (45% of our genome), and other non-coding sequences may or may not be functional — that requires evidence — and some may exist as a result of accidental duplication or even due to selection at the level of the elements themselves (by “intragenomic selection”). The old assumption that all non-coding DNA must be beneficial to the organism or it would have been deleted by now ignores genome-specific processes by which non-coding DNA evolves.

As I have discussed previously, both hardcore adaptationists (if any exist anymore) and creationists have a vested interest in having all non-coding DNA be functional. I believe that real-world variability in genome size argues strongly against such a prospect, but of course it is possible, and this is the point that people like Ohno, Doolittle, Orgel, and Crick made in the 1980s. The important point is that yes, some non-coding DNA is functional at the organism level (as opposed to existing for its own sake or because there is no strong selection against it). And certainly, non-coding DNA has effects at the organism level. But current evidence suggests that about 5% of the human genome is functional, and even the least conservative ENCODE participants (whose primary, and important, objective is to identify the functional elements and their features) are betting that 20% is functional.

In the end, it is obvious that non-coding DNA is the product of evolution whether it all turns out to be functional or not. The cases in which former parasites (transposons) have taken on function at the organism level are a perfect illustration of cooption, which is the same basic process that allows explanations for the evolution of complex structures like eyes or flagella. The research into function of non-coding DNA, which the creationists are eager to cite, can be carried out only under an evolutionary framework — it is meaningless to talk about “conserved non-coding DNA sequences” otherwise.

Finally, let me say one thing about Francis Collins’s quote: “Think about it the way you think about stuff you keep in your basement. Stuff you might need some time. Go down, rummage around, pull it out if you might need it.” With all due respect (which is considerable, given his contribution to the Human Genome Project), it makes no sense to explain the existence of non-coding DNA because it might someday prove useful. Evolution does not work that way. Elements might be coopted, but maintaining this option explains neither the origin nor the persistence of non-coding sequences.

As to what the creationists have to say, well, I leave that to others with more (or less?) patience to attend to.

____________

Updates:


Genomes large and small.

The past few years have witnessed the discovery of both very large and small genomes in different groups of organisms. Here are some highlights from this research.

The first represents the largest genome so far reported for a crustacean, in the Arctic-dwelling amphipod Ampelisca macrocephala. The genome of this small invertebrate is a whopping 63.2 billion base pairs, or about 20 times larger than the human genome (Rees et al. 2007). Again, this sort of observation should dispel the notion that all non-coding DNA is functional for protecting against mutagens or some such thing.

The second interesting finding is of the largest viral genome so far discovered. The virus, dubbed Mimivirus, was sufficiently odd that it was originally assumed to be a bacterium when first observed, but on closer examination was found to be a virus. Its genome size is estimated as 1.2 million bases, which is larger than the genome of many bacteria (Raoult et al 2007). So, now there is overlap in reported genome sizes between viruses and bacteria, which goes along with the known overlap between the genome sizes of bacteria and eukaryotes (Gregory 2005).

And now for some small genomes. More specifically, the smallest flowering plant genome, that of Genlisea margaretae at a mere 63 million base pairs, less than half the size of the previous record holder, Arabidopsis thaliana at about 157 million base pairs. This increases the range in angiosperm genome sizes to more than 2,000-fold. (In animals the total range is about 3,300-fold; Gregory et al. 2007).

The smallest insect genome so far estimated was reported fairly recently as well. It belongs to Caenocholax fenyesi, a twisted-wing parasite, and is a mere 108 million base pairs (Johnston et al. 2004). Not to spoil the fun, but my lab has also found genome sizes this small in other groups, though these have not yet been published. The largest insect genome size known is found in the mountain grasshopper Podisma pedestris at 16.6 billion base pairs (Westerman et al. 1987).

The smallest eukaryotic genome known to date is that of the protist Encephalitozoon intestinalis, a parasitic microsporidian with a genome size of only 2.3 million base pairs, which is smaller than that of many bacteria (Vivarès and Méténier 2000). The smallest free-living eukaryote genome size is found in Ostreococcus tauri at 12.6 million base pairs (Derelle et al. 2006). The largest reliable protozoan genome size estimate reported to date is 97.8 billion base pairs in the dinoflagellate Gonyaulax polyedra (Shuter et al. 1983). That is a more than 33,000-fold range among protists.

It should be pointed out that the largest published eukaryote genome size estimate is 1,400 billion base pairs (400 times larger than human) in the free-living amoeba Chaos chaos (Friz 1968), although the largest genome size is often attributed to Amoeba dubia at 700 billion base pairs based on the same study. These data are not generally considered reliable, for several reasons. First, these values for amoebae were based on rough biochemical measurements of total cellular DNA content, which probably includes a significant fraction of mitochondrial DNA. Second, Friz’s (1968) value of 300pg for Amoeba proteus is an order of magnitude higher than those reported in subsequent studies (Byers 1986). Third, some amoebae (e.g., A. proteus) contain 500-1000 small chromosomes and are quite possibly highly polyploid (Byers 1986), in which case these values would be inappropriate for a comparison of haploid genome sizes among eukaryotes.

Finally, the smallest genome so far known for any cellular organism also was discovered recently — that of the endosymbiotic bacterium Carsonella ruddii at a miniscule 159,662 base pairs (Nakabachi et al. 2006). This species resides within specialized cells inside the body of psyllid insect hosts. The genome is so small, and the insect and bacterium so mutually dependent, that this species blurs the lines between bacteria and organelles, and probably is similar in some ways to an intermediate stage in the evolution of other obligate intracellular symbionts turned organelles like mitochondria and chloroplasts.

The old assumption, still often repeated, that viruses have smaller genomes than bacteria which have smaller genomes than single-celled eukaryotes which have smaller genomes than multicellular eukaryotes is beginning to wear thin. The pattern remains in a general sense, but focusing only on such a coarse scale overlooks a significant amount of diversity within, and increasingly apparent overlap between, groups of life.

___________

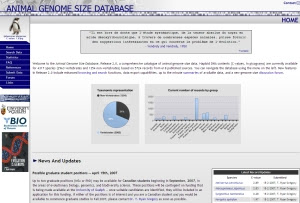
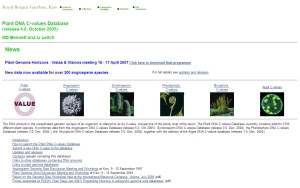
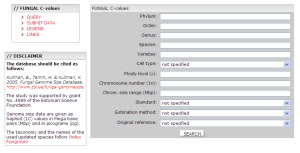
Readers interested in exploring genome size data can check out the various online databases for more.

References

Byers, T.J. 1986. Molecular biology of DNA in Acanthamoeba, Amoeba, Entamoeba, and Naegleria. International Review of Cytology 99: 311-341.

Derelle, E., C. Ferraz, S. Rombauts, P. Rouzé, A.Z. Worden, S. Robbens, F. Partensky, S. Degroeve, S. Echeynié, R. Cooke, Y. Saeys, J. Wuyts, K. Jabbari, C. Bowler, O. Panaud, B. Piégu, S.G. Ball, J.P. Ral, F.Y. Bouget, G. Piganeau, B. De Baets, A. Picard, M. Delseny, J. Demaille, Y. Van de Peer, H. Moreau. 2006. Genome analysis of the smallest free-living eukaryote Ostreococcus tauri unveils many unique features. Proceedings of the National Academy of Sciences of the USA 103: 11647-11652.

Friz, C.T. 1968. The biochemical composition of the free-living amoebae Chaos chaos, Amoeba dubia, and Amoeba proteus. Comparative Biochemistry and Physiology 26: 81-90.

Gregory, T.R. 2005. Synergy between sequence and size in large-scale genomics. Nature Reviews Genetics 6: 699-708.

Gregory, T.R., J.A. Nicol, H. Tamm, B. Kullman, K. Kullman, I.J. Leitch, B.G. Murray, D.F. Kapraun, J. Greilhuber, and M.D. Bennett. 2007. Eukaryotic genome size databases. Nucleic Acids Research 35 (Suppl. 1): D332-D338.

Greilhuber, J., T. Borsch, K. Müller, A. Worberg, S. Porembski, W. Barthlott. 2006. Smallest angiosperm genomes found in lentibulariaceae, with chromosomes of bacterial size. Plant Biology 8: 770-777.

Johnston, J.S., L.D. Ross, L. Beani, D.P. Hughes, and J. Kathirithamby. Tiny genomes and endoreduplication in Strepsiptera. Insect Molecular Biology 13: 851-585.

Nakabachi A, A. Yamashita, H. Toh, H. Ishikawa, H.E. Dunbar, N.A. Moran, and M. Hattori. 2006. The 160-kilobase genome of the bacterial endosymbiont Carsonella. Science 314: 267.

Raoult, D., B. La Scola, and R. Birtles. 2007. The discovery and characterization of Mimivirus, the largest known virus and putative pneumonia agent. Clinical Infectious Diseases 45: 95-102.

Rees, D.J., F. Dufresne, H. Glémet, and C. Belzile. 2007. Amphipod genome sizes: first estimates for Arctic species reveal genomic giants. Genome 50: 151-158.

Vivarès, C.P. and G. Méténier 2000. Towards the minimal eukaryotic parasitic genome. Current Opinion in Microbiology 3: 463–467.

Westerman, M., N.H. Barton, and G.M. Hewitt (1987). Differences in DNA content between two chromosomal races of the grasshopper Podisma pedestris. Heredity 58: 221-228


Pioneers of genome size: Prof. Michael D. Bennett.

Prof. Mike Bennett is well known in the genome size community for his work in conducting and compiling genome size estimates in plants and as the originator of the “nucleotypic theory” in which DNA content exerts a causative influence on nucleus and cell size and is therefore of adaptive significance.

He completed his undergraduate degree in 1965 in the
Department of Agricultural Botany at the University College of Wales, Aberystwyth, UK, where he first learned to estimate nuclear DNA contents. He earned his PhD in 1968 under the supervision of Prof. Huw Rees, also in Aberystwyth.

Prof. Bennett in the lab, circa 1996.

Part of his PhD research involved investigating the work of Pearce (1937, Bull.Torrey Bot. Club 64: 345-355) who in 1937 had reported how chromosomes of Viola conspersa varied in size by over 300% depending on the amount of phosphate in the culture solution. One of Prof. Bennett’s roles was to investigate whether such changes in chromosome size were also accompanied by changes in genome size. In an early paper arising from his PhD (Bennett MD, Rees H. 1967. Natural and induced changes in chromosome size and mass in meristems. Nature 215: 93-94), he showed that in rye (Secale cereale) there was no change in genome size despite changes in chromosome volume of 50% depending on the phosphate level.

Prof. Bennett’s first post-doctoral fellowship was
with Sir Ralph Riley at the Plant Breeding Institute, Cambridge, UK, looking at the mechanisms of meiosis in cereals. Part of this work involved measuring the duration of meiosis in a number of cereals. He correlated this with genome size to produce the well-known paper (Bennett MD. 1971. The duration of meiosis. Proceedings of the Royal Society of London B 178: 277-299) in which he coined the term “nucleotype” (cf. “genotype”) to reflect”that condition of the nucleus [most notably, DNA content] that affects the phenotype independently of the informational content of the DNA”. He also carried out large scale analysis of relationship between genome size and minimum generation time (Bennett MD. 1972. Nuclear DNA content and minimum generation time in herbaceous plants. Proceedings of the Royal Society of London B 181: 109-135).

It soon became evident that there was a need to collate widely spread plant genome size data into one accessible source, and so he began producing the lists of DNA amounts (the first one in 1976, followed by 7 others since then) which together contain data for over 4400 angiosperm species. These papers have been cited more than 1,500 times. This was later followed by the electronic databases (first release of Angiosperm DNA C-values database in 1997, followed by the Plant DNA C-values Database in 2000).

In 1987, Prof. Bennett became Keeper of the Jodrell Laboratory at the Royal Botanic Gardens , Kew, where he remained until his retirement in 2006. Throughout his scientific career, Prof. Bennett has authored and coauthored more than 320 publications, many of which are on genome size.

Prof. Mike Bennett in 1988, soon after becoming Keeper of the Jodrell Lab at Kew.

I first met Mike at a the 2003 Genome Size Meeting at Kew, and it has been my privilege to work with him on a few projects since that time, including having him author a chapter in The Evolution of the Genome and coauthoring a paper about our genome size databases published earlier this year.

Group photo at the 2003 Genome Size Meeting at Kew.

In light of his recent “retirement” (no one who knows him believes for a second that he will stop working, in fact he estimates that he still has at least another 50 papers to write), it seems fitting to have him as the first person profiled in the Pioneers of Genome Size series. Congratulations on a job well done, my friend, and cheers to the future.

[Special thanks to Dr. Ilia Leitch for information and photos]


Genome size databases.

In case anyone is unaware of their existence, here are the links to the available genome size databases.

For a summary of the databases, see Gregory et al. (2007).

For a discussion about units of measurement in genome size, see here.

A summary of genome size ranges in various animals is available here.

A much smaller database of genome sizes that also includes some taxa besides animals, plants, and fungi is posted here.

For bacterial and archaeal (“prokaryote”) genome size data, see here and here and here.

For a list of completed and ongoing genome sequencing initiatives, see the Genomes OnLine Database (GOLD).

For vertebrate red blood cell sizes, see here.


The onion test.

I am not sure how official this is, but here is a term I would like to coin right here on my blog: “The onion test”.

The onion test is a simple reality check for anyone who thinks they have come up with a universal function for non-coding DNA1. Whatever your proposed function, ask yourself this question: Can I explain why an onion needs about five times more non-coding DNA for this function than a human?

The onion, Allium cepa, is a diploid (2n = 16) plant with a haploid genome size of about 17 pg. Human, Homo sapiens, is a diploid (2n = 46) animal with a haploid genome size of about 3.5 pg. This comparison is chosen more or less arbitrarily (there are far bigger genomes than onion, and far smaller ones than human), but it makes the problem of universal function for non-coding DNA clear2.

Further, if you think perhaps onions are somehow special, consider that members of the genus Allium range in genome size from 7 pg to 31.5 pg. So why can A. altyncolicum make do with one fifth as much regulation, structural maintenance, protection against mutagens, or [insert preferred universal function] as A. ursinum?

Left, A. altyncolicum (7 pg); centre, A. cepa (17 pg); right, A. ursinum (31.5 pg).


There you have it. The onion test. To be applied to any ambitious claims that a universal function has been found for non-coding DNA.

____________

1 I do not endorse the use of the term “junk DNA”, which I think has deviated far too much from its original meaning and is now little more than a loaded buzzword; the descriptive term “non-coding DNA” is what I use to refer to the majority of eukaryotic sequences (of various types) that do not encode protein products.

2 Some non-coding DNA certainly has a function at the organismal level, but this does not justify a huge leap from “this bit of non-coding DNA [usually less than 5% of the genome] is functional” to “ergo, all non-coding DNA is functional”.