Another good science story.

I have been a bit harsh with science writers on a few occasions, though this has often been in good fun. I actually have a lot of respect for (good) science writers, and I think their job is a very important one — which is why I think it is critical that they do it well. If they were irrelevant, they would garner no attention from scientist-commentators like me.

A few times, I have pointed out stories that I think are very good, and have given credit where it is due. I single out JR Minkel, Aria Pearson, Heather Kowalski, and of course Carl Zimmer as excellent examples.

I will continue to point out both good and bad science writing, and to contribute where I am needed in the form of interviews or commentary. Today I want to link to another good story, this time a press release from the University of Bristol as posted by ScienceDaily.

How The Discovery Of Geologic Time Changed Our View Of The World

This piece does the opposite of my guide to writing a bad science story. It provides some historical context. It shows how knowledge has accrued through the efforts of many researchers. It highlights the difficulty of getting a new idea recognized and how even “revolutionary” propositions do not become accepted overnight. Plus, it’s always useful to know some history of science and to give credit to those giants upon whose shoulders we stand.


Junk DNA: let me say it one more time.

Let me say it one more time.

The term “junk DNA” was not coined on the basis of not knowing what it does. It was not a cop-out or a surrender. Susumu Ohno coined the term in 1972 in reference to a specific mechanism of non-coding DNA formation that he thought accounted for the discrepancies in genome size among species: gene duplication and pseudogenization. That is, a gene is duplicated and one of the copies becomes degraded by mutation to the point of being non-functional with regard to protein coding. (Sometimes the second copy takes on a new function through “neofunctionalization”, or the two copies may split the original function through “subfunctionalization”). “Junk” meant “something that was functional (a gene) but now isn’t (a pseudogene)”.

It has turned out that non-coding DNA is far more complex than just pseudogenes. It also includes transposable elements, introns, and highly repetitive sequences (e.g., microsatellites). For the most part, the mechanisms by which these form are reasonably well understood, and as a result there is good reason to expect that many or even most of them are not functional for the organism. Many authors argue that most non-coding DNA is non-functional, not because of a lack of imagination, but on the basis of a large amount of information regarding its mechanisms of accumulation.

Some non-coding DNA is proving to be functional, to be sure. Gene regulation, structural maintenance of chromosomes, alternative splicing, etc., all involve sequences other than protein-coding exons. But this is still a minority of the non-coding DNA, and there is always the issue of the onion test when considering all non-coding DNA to be functional.

And finally, it needs to be pointed out again that evolutionary biologists and geneticists held a variety of views on functionality, some claiming that it was all functional, some saying very little (but few, if any, saying it was all totally non-functional). Strict adaptationist (“ultra-Darwinian”) thinking had led many authors to assume that non-coding DNA must be doing something useful or it would have been eliminated by selection long ago. The proponents of the “selfish DNA” approach to non-coding DNA wrote their papers in direct response to this overly adaptationist interpretation and argued that much of it could be explained simply by the existence of mechanisms that put it there, independent of organism-level function. But even they expected that some would turn out to play a role in regulation. At the same time, most researchers for the past half century have noted the link between DNA amount and cell size, which means that total non-coding DNA content is not irrelevant biologically. This could, however, be an effect instead of a function, which is why there has for decades been discussion about this issue.

You can tell someone who knows very little about the science or history of “junk DNA” when they make one or more of the following claims: 1) All scientists have always thought it was all totally irrelevant to the organism. 2) New evidence is suggesting that it is all functional. 3) “Darwinism” led to the assumption that non-coding DNA is non-functional. The opposite is true in each case.

One can discuss possible functions for non-coding DNA — that’s not a problem, and it makes for an interesting topic if data are used to back up claims — but please stop distorting the views of scientists both past and present in the process.

___________

See also


Genome size and gene number.

In a previous discussion [What’s wrong with this figure?], I noted that certain things seem to happen with disturbing frequency in discussions of genome size. The first is the invocation of pre-Darwinian “Great Chain of Being” thinking, in which humans are considered the most complex organisms, with all others ranked at lower positions on the scala naturae. Of course, this is not restricted to genomics — one can find references to “lower vertebrates”, “subhuman primates”, or “higher plants” peppered throughout the scientific literature. The second issue is the exclusive use of genome sequence data in discussions of genome size diversity. This is problematic because, with few exceptions, sequencing targets are selected in large part on the basis of having small and manageable genomes. I receive many requests from colleagues to provide genome size estimates, and the hope is always that they will turn out to be small such that they will have a chance of being adopted as a sequencing model. There are obvious pragmatic reasons for this, but it means that one must be careful about interpreting data from an inherently biased set of data.

The previous discussion focused on examples in which authors have tried to demonstrate a link between the amount of non-coding DNA and organismal complexity, by making both of the mistakes outlined above. In this post, I want to discuss the opposite but equally aggravating problem, which is using these same limited data to demonstrate an association between genome size and gene number.

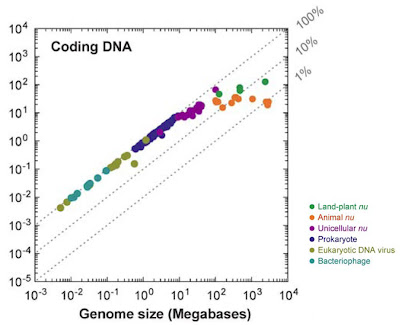
Every now and then, an author makes the claim that gene number and genome size actually are correlated, despite this having been rejected decades ago when the first broad comparisons of genome size were made and the various sorts of non-coding DNA were discovered. The most recent example comes from Lynch (2006):

The same figure appears in Lynch (2007). Click for larger view.

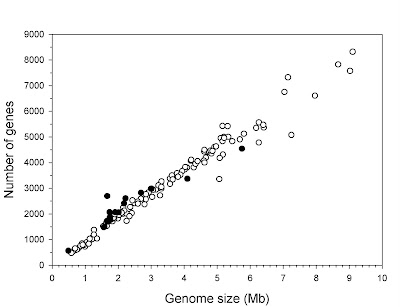
There are two problems that I see with this figure. The first is that it lumps together viruses, bacteria, and eukaryotes. Although Lynch (2006, 2007) argues that there is a smooth continuum between the parameters across these taxonomic boundaries, and thus that there is no difficulty when combining these data, I would suggest that the very different genomic properties of these groups should be cause for questioning this approach. For example, it is well known that gene number and genome size are strongly correlated among “prokaryotes”, because they generally exhibit a paucity of non-coding DNA. This means that including them anchors the correlation at the bottom end.

Genome size is strongly related to gene number in both archaea and bacteria. Figure from Gregory and DeSalle (2005). Click for larger view.

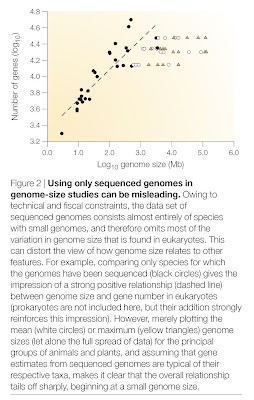
The second problem is, obviously, that this is based on a selective set of species. An estimate of gene number is best achieved with a genome sequence, but genome sequences typically are available only for small genomes. If one assumes that most species in a given group (say, a phylum) have roughly similar gene numbers and plots the actual diversity of genome size (e.g., mean for that phylum), the relationship is nowhere near as clear. Indeed, it drops off completely.

From Gregory (2005). Click for larger view.

In fact, you can see this happening already in Lynch’s (2006, 2007) figure. Note that there is a totally flat line for the animal data, even though these come from species with comparatively modest genome sizes. Since I work on animals (whose genome sizes range 3,300-fold), I would say that there is no relationship between genome size and gene number in my group. If you compare animals to bacteria, then there is such a relationship, of course, but that almost goes without saying, and could relate to differences in chromosome structure as much as anything else.

The point is that genome sequencing data are extremely useful, including in discussions of genome size, but that they, like all data, must be interpreted within their proper context. Genome sequencing models, at least at the moment, do not encompass the diversity that exists among eukaryotes. In fact, even with 10,000 species in the various databases [animals, plants, fungi], the current dataset of eukaryotic genome size diversity itself is far from comprehensive.

The diversity of archaeal, bacterial, and eukaryotic genome sizes as currently known from more than 10,000 estimates. From Gregory (2005). Click for larger view.

What is clear, and has been for decades, is that genome size evolves independently of organismal complexity and gene number (which themselves may evolve more or less independently of one another). This makes it a very intriguing puzzle to study, one that has resisted all attempts at one-dimensional explanation for over half a century.

___________

References

Gregory, T.R. 2005. Synergy between sequence and size in large-scale genomics. Nature Reviews Genetics 6: 699-708.

Gregory, T.R. and DeSalle, R. 2005. Comparative genomics in prokaryotes. In: The Evolution of the Genome, edited by T.R. Gregory, pp. 585-675. Elsevier, San Diego, CA.

Lynch, M. 2006. Streamlining and simplification of microbial genome architecture. Annual Review of Microbiology 60: 327-349.

Lynch, M. 2007. The Origins of Genome Architecture. Sinauer Associates, Sunderland, MA.

See also


What’s wrong with this figure?

There is a story on Science News Online entitled “Genome 2.0“. The author has certainly done a lot of legwork and has tried to present a detailed discussion of a complex topic, and for that he deserves considerable credit. (He clearly hasn’t taken my guide to heart). That said, it is unfortunate that the author has fallen into the trap of repeating the usual claims about the history (everyone thought it was merely irrelevant garbage) and potential function (some is conserved and lots is transcribed, so it all must be serving a role) for “junk DNA”. As a result, I won’t comment much more on it. One thing that may be relevant to point out about this story in particular is the first figure it uses. This is a figure I have seen in a few places, including in the scientific literature. It makes me cringe every time because it reveals a real problem with how some people approach the issue of non-coding DNA. And so, 10 points to the first person who can point out what is deeply problematic about the interpretation it is often granted. I include the legend as provided in the original report.

JUNK BOOM. Simpler organisms such as bacteria (blue) have a smaller percentage of DNA that doesn’t code for proteins than more-complex organisms such as fungi (grey), plants (green), animals (purple), and people (orange).


(See also Genome size and gene number)
________________


Update:

The 10 points has been awarded twice on the basis of two major problems being pointed out.

The first is that the graph arranges species according to % noncoding DNA and assumes that everyone will agree that the X-axis proceeds from less to more complex. This is classic “great chain of being” thinking. No criteria are specified by which the bacteria are ranked (and it is simply ignored that Rickettsia has a lot of pseudogenes which appear to be non-functional), which is bad enough. Worse yet, there is really no justification for ranking C. elegans as more complex than A. thaliana other than the animal-centric assumption that all animals must be more sophisticated than all plants.

The second, and the one I had in mind, is that this is an extremely biased dataset. Specifically, it is based on a set of species whose genomes have been sequenced. These target species were chosen in large part because they have very small genomes with minimal non-coding DNA. The one exception is humans, which was chosen because we’re humans. As has been pointed out, even if you chose a few of the more recently sequenced genomes (say, pufferfish at 400Mb and mosquito at 1,400Mb) this pattern would start to disintegrate. If you look at the actual ranges or means of genome size among different groups, you will see that there are no clear links between complexity and DNA content, despite what some authors (who focus only on sequenced genomes) continue to argue.

To illustrate this point, this figure shows the means (dots) and ranges in genome size for the various groups of organisms for which data are available. This represents estimates for more than 10,000 species. This is intentionally arranged along the same kind of axis of intuitive notions of complexity just to show how discordant “complexity” and genome size actually are. Humans, it will be noted, are average in genome size for mammals and not particularly special in the larger eukaryote picture.

Means and ranges of haploid DNA content (C-value) among different groups of organisms. Click for larger image. Source: Gregory, TR (2005). Nature Reviews Genetics 6: 699-708.

Maybe you will join me in cringing the next time you see a figure like the one in the story above.

Update (again):

Others have criticized this kind of figure before. As a case in point, see John Mattick’s (2004) article in Nature Reviews Genetics and the critical commentary by Anthony Poole (and Mattick’s reply). Obviously, I am with Poole on this one.

The Evolution of the Genome in China

Last week I was at Iowa State University as the grad students’ choice of seminar speaker for the fall semester. It seems a good number of the people there have found The Evolution of the Genome useful, which is very rewarding since it was written with graduate students prominently in mind. Anyway, I returned to my office in Guelph this morning only to be presented with two copies of The Evolution of the Genome — with a Chinese cover. The cover, preface, and table of contents are in Chinese, but the rest of the book is in English. It probably would have been more useful (and more expensive) to translate the entire thing, but hopefully this will make it more accessible in some way. The funny thing is that I had no idea any other editions were in the works until today.


Ultraconserved non-coding regions must be functional… right?

Whereas the possibility that non-coding DNA is functional has been a topic of discussion for decades, it recently has come to the fore with the availability of several sequenced genomes which allow signs of function to be detected at the DNA level. The multi-million-dollar ENCODE project is the largest initiative focused on identifying functional elements in the human genome, but many smaller projects are also ongoing in other species such as mice, Drosophila, and other eukaryotes (e.g., Siepel et al. 2005).

For the most part, the way that potentially functional elements are highlighted is by finding regions of the genome that are essentially unchanged among species whose lineages have been separated for very long periods of time. No change in the sequences suggests that they have been preserved in their present state by natural selection — that is, individuals with mutations in these regions were less fit, and only those with no such changes have left an unbroken line of descendants to the present day. A recent analysis by Katzman et al. (2007) in Science indicated that indeed these “ultraconserved” regions are “ultraselected” in the human genome. Because natural selection is the result of differential survival and reproduction due to heritable phenotypic differences, this provides strong evidence that these regions have some important effect — in fact, probably a function — on the organisms carrying them.

It is important to note that elements exhibiting signs of selective constraint make up a small fraction of the total genome of organisms like mammals, on the order of 5%. Ultraconserved elements in particular represent a very tiny portion of the total DNA. It would therefore be a major exaggeration to assume that the demonstration of such sequences implies that all non-coding DNA is functional. Most or all of it might serve a function, but there is no evidence to support this notion at present. It is also inaccurate to suggest that the discovery of some function in non-coding DNA is a total surprise. Even the early proponents of the “selfish DNA” view of non-coding DNA evolution proposed that some elements would end up being functional, most notably in gene regulation. This certainly appears to have been borne out, and it is quite plausible that more than just the ultraconserved elements are involved in the regulation of coding genes.

However, amidst this backdrop of increasingly refined tabulations of conserved elements in animal genomes there are some observations that raise doubts about just how important they are for organismal fitness. In 2004, for example, Marcelo Nóbrega and colleagues put the importance of conserved non-coding DNA to the test — by deleting some of it. Specifically, they removed two fragments of conserved DNA totaling 1,511 kilobases and 845kb in mice and observed the consequences. Or, more accurately, the lack of consequences. In their experiment, the deletion of more than 2 million base pairs of conserved DNA from the mouse genome had no identifiable effects on the development, physiology, or reproduction of the subjects.

Of course, the mice were kept in lab conditions, and it was argued by some that this may be an unrealistic test given that conditions in the wild are much harsher and any detriment to growth or survival may be hidden in the lab.

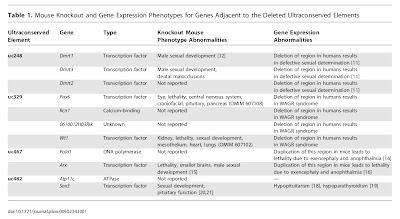
In the September 2007 issue of the open access journal PLoS Biology, Nadav Ahituv and coworkers report on a similar but more telling experiment, again using deletions of ultraconserved DNA elements in mice. In this case, the authors deleted four elements ranging in length from 222 to 731bp in ultraconserved regions that are invariant among humans, mice, and rats. More importantly, these regions are known to be located in close proximity to genes for which loss of function mutations result in severe abnormalities.

(List of genes adjacent to ultraconserved elements. Click for larger image)


The assumption, therefore, was that if these regions are conserved because they regulate nearby genes, then their removal should disrupt gene function and result in inviable mice. What did they find?

Nothing. No effect whatsoever was detectable in terms of growth, morphology, reproduction, metabolism, or longevity when any of the four elements was deleted. Again, it is possible that some deleterious effect would show up in the wild, or that there is redundancy that allows other elements to regulate these genes if need be, but as far as the expected phenotypic consequences of disrupting the nearby genes goes, it makes no difference whether these specific conserved sequences are present or not.

At the moment, there is no conclusive evidence one way or another as to the function of most non-coding DNA. It bears noting, however, that although it is very difficult to demonstrate that so much non-coding DNA is non-functional (as this is roughly akin to proving a universal negative), there are reasons to adopt this as the default hypothesis. For example, several mechanisms are known that can generate large amounts of non-coding DNA independent of organismal functions. On the other hand, the evidence for function is thus far restricted to a few percent of the genome, and even here it appears that some of these elements can be eliminated without obvious consequences.

This is not to say that non-coding DNA has no effect; it clearly influences cell size and cell division rate, for example. It is, however, far outstripping the available evidence, and contradicting much of what is already known about genome evolution, to argue that comparative genomics is revealing functions for non-coding DNA at large. At most, genomic analysis is showing genome form, function, and evolution to be much too complex to support any inflexible assumptions on either side.

___________

References

Ahituv, N. et al. (2007). Deletion of ultraconserved elements yields viable mice. PLoS Biology 5(9): e234.

ENCODE Project Consortium (2007). Identification and analysis of functional elements in 1% of the human genome by the ENCODE pilot project. Nature 447: 799-816.

Gross, L. (2007). Are “ultraconserved” genetic elements really indispensable?. PLoS Biology 5(9): e23.

Katzman, S. et al. (2007). Human genome ultraconserved elements are ultraselected. Science 317: 915.

Nobrega, M.A. et al. (2004). Megabase deletions of gene deserts result in viable mice. Nature 431: 988-993.

Siepal, A. et al. (2005). Evolutionarily conserved elements in vertebrate, insect, worm, and yeast genomes. Genome Research 15: 1034-1050.

___________

Update:

Larry Moran has a nice piece on this at Sandwalk. There is also a post about it at This Week in Evolution. Kay of Suicyte (great title — he works on apoptosis) has an interesting post as well. And for goodness sake, could someone please go read Chris Harrison’s earlier post on Interrogating Nature so he can’t stop the crank-like self promotion in all the discussion threads? (Just kidding, Chris –it’s a nice post).


Hooray for HuRef! J. Craig Venter’s genome sequenced.

The first diploid human genome sequence, and the first truly complete sequence from a single individual — notably but perhaps not surprisingly Dr. J. Craig Venter — is now available. The paper describing Dr. Venter’s genome (which has been labeled “HuRef”) is published in the open access journal PLoS Biology, so feel free to take a look.

Previous sequences for the “human genome” represented composites from multiple individuals [Whose genome?] and were haploid. As a result, it was not possible to determine the extent of intragenomic variation or the degree to which the two copies of a genome in a diploid organism — one derived from the father, one from the mother — interact with one another. The availability of this new sequence opens several new possibilities for detailed analysis, in addition to ushering in the era of personal genomics.

As Venter said,

Each time we peer deeper into the human genome we uncover more valuable insight into our intricate biology. With this publication we have shown that human to human variation is five to seven-fold greater than earlier estimates proving that we are in fact more unique at the individual genetic level than we thought. It is clear however that we are still at the earliest stages of discovery about ourselves and only with additional sequencing of more individual genomes will we garner a full understanding of how our genes influence our lives.

Dr. James Watson, co-deducer of the double helix structure of the DNA molecule and Nobel Prize winner, also had his genome sequenced this year.

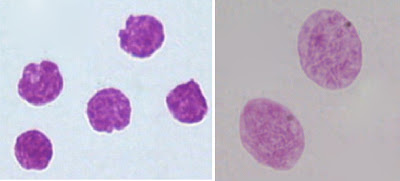
I would be happy to donate a sample of DNA if they need a third genome for comparative analysis. I note that my genome, or at least pictures of my nuclei, has been published before:

Leukocytes? Buccal epithelia? I got what you need.

As a side note, Heather Kowalski at the JCVI has provided a superb example of an informative and effective press release.


Guide to translating scientific papers into plain English.

It seems that some people missed the point of my previous post [Anatomy of a bad science story], which used irony as a rhetorical device to get an important point across. It also was meant to be funny, with the assumption that good science writers would find it as amusing and therapeutic as scientists would.

But just to show that we scientists a) have a sense of humour, and b) can laugh at ourselves, here is one of my favourite lists:

Guide to Translating Scientific
Papers Into Plain English

Statement

Really means

It has long been known… I haven’t bothered to look up the reference.

It is thought that… I think so.

It is generally thought that… A couple of other guys think
so, too.

It is not unreasonable to assume… If you believe this, you’ll believe anything.

Of great theoretical importance…

I find it interesting.
Of great practical importance…

I can get some good mileage out of it.

Typical results are shown.

The best results are shown.

Three samples were chosen for further study. The others didn’t make sense, so we ignored them.

The second sample was not used. I dropped it on the floor.

Results obtained using the second sample must be interpreted with caution.

I dropped it on the floor, but managed to scoop most of it up.
Correct within an order of
magnitude.

Incorrect.
Much additional work will be required.

This paper isn’t very good, but neither is anyone else’s.

These investigations provided highly rewarding results.

My grant will be renewed.
This research was supported by a grant from… Can you believe they pay me to do this?

A line of best fit was generated using least-squares regression.

I drew it by hand.
A non-linear relationship was found…

I drew it by hand and I didn’t use a ruler.

Stringent controls were implemented…

My advisor was watching.

I thank X for assistance with the experiments and Y for useful discussions on the interpretation of the data. X did the experiment and Y explained it to me.


Anatomy of a bad science story.

There are many good science writers and press officers around. This post is not for them, as they will certainly reject all of its key points. Nor is it for the members of the media who are already adept at producing sensationalistic, inaccurate, or downright ridiculous science news stories. This post is for those writers somewhere in the middle who sometimes get it wrong but can’t quite master the art of atrocious science reporting.

Here, then, is a concise guide for how to write really bad science stories.

1. Choose your subject matter to be as amenable to sensationalism as possible.

Some scientific studies may be considered elegant and important by scientists, but if they help to confirm previous thinking or provide only incremental advances in understanding, they are not newsworthy. What you need is something that will generate an emotional rather than intellectual response in the reader.

(If you’re stuck on this step, try coming up with a topic that fits into Science After Sunclipse‘s handy list of categories for science stories.)

2. Use a catchy headline, especially if it will undermine the story’s credibility.

The headline is what draws the reader in, and it is very important that this be as catchy and misleading as possible. Try to focus on outrageous claims. “Such-and-such theory overthrown by this-and-that discovery” is a good template. If possible, have an editor who has not read the story or knows very little about the topic come up with a headline for you.

3. Overstate the significance and novelty of the work.

Do your best to overstate the importance of the new discovery being reported. This is especially relevant if you are writing a press release at a university or other large research institution. The discovery must, at the very least, be described as “surprising”, but “revolutionary” is vastly more effective. Indeed, the reader should wonder what, if anything, those idiot scientists were doing before this new research was conducted (see step 4). Avoid implying that there is a larger research program underway in the field or that the new discovery fits well with ideas that may be decades old. Also, if the discovery — no matter what it is — can be linked, however tenuously, to curing some human ailment, so much the better.

(For writers reporting about genomics: if your story is outrageous enough, you may be eligible for an Overselling Genomics Award; note, however, that competition for this distinction is intense).

4. Distort the history of the field and oversimplify the views of scientists.

Whenever possible, characterize the history of the field in which the discovery took place as simplistic and linear. It is very important that previous opinion in the field be seen as both monotonic and opposed to the new discovery. If there are signs that researchers have held a diversity of views, some of which are fully in line with the new finding, this will undermine your attempt to oversell the significance of the study (see step 3). For this, there are few better examples than recent work on so-called “junk DNA“. Here, authors of news stories have managed to convince readers that “junk” was unilaterally assumed to mean biologically irrelevant, and that it is only in the face of new discoveries that stubborn scientists are being pushed to reconsider their opinions. The fact that both of these are utter nonsense shows how effective this approach can be.

5. Remember that controversy sells, and everyone loves an underdog.

If the results of a new study do not contradict some long-held assumption or incite disagreement among scientists, then readers will have little interest. As a consequence, it is important to characterize science as a process of continual revolutions (see steps 3 and 4) rather than one of continuous improvement of understanding. Refinement and expansion of existing ideas should not be implied. If there is no real controversy, invent one. And, whenever possible, set it up as a “David vs. Goliath” conflict between an intrepid scientist and the stuffy establishment.

6. Use buzzwords and clichés whenever possible.

It doesn’t matter if the words are used inappropriately or appeal to common misconceptions (see step 7), if it is catchy or well known, use it and use it often. This is particularly important if you would otherwise have to introduce readers to accurate terminology and novel concepts. “Genome sequencing” should be dubbed “cracking the code” or “decoding the blueprint” or “mapping the genome”, for example, even though these clichés are quite inaccurate.

7. Appeal to common misconceptions, and substitute your own opinions and misunderstandings for the views of the scientific community.

It is important that readers’ misconceptions not be challenged when reading a news story. In fact, the more a report can reinforce misunderstandings of basic scientific principles, the better. This can be combined with step 6 to good effect. It is also helpful to insert your own views and misunderstandings as though they were those of the scientific community at large. For example, if you find something confusing, mysterious, or (un)desirable, assume that the scientific community as a whole shares your view.

8. Seek balance, particularly where none is warranted.

A primary tenet of journalism is that it present a balanced view of the story and not make any subjective judgments. The fact that the scientific community has semi-objective methods for determining the reliability of claims (such as peer review and the requirement of repeatably demonstrable evidence) should not impinge on this. It is therefore important to present “both sides” of every story, even if one side lacks any empirical support and is populated only by a tiny minority of scientists (or better yet, denialists and cranks). This does not necessary conflict with step 5, because a false controversy can be set up using an appeal to balance. For example, a productive strategy is to provide one quote from someone at the periphery of the field and one quote from a recognized expert to make it seem as though there is debate about an issue within the scientific community. Under no cricumstances should you explain why the scientific community does not accept the views of the non-expert. This has proven very effective in stories about issues that are controversial for political but not scientific reasons, such as evolution and climate change.

9. Obscure the methods and conclusions of the study as much as possible.

Try not to give many details about the study. A simplistic analogy is much better than actually describing the methodology. Better yet, don’t discuss the methods at all and simply focus on your own interpretation of the conclusions. Be sure to describe said conclusions in terms of absolutes, rather than the probabilistic or pluralistic ways in which scientists tend to summarize their own results. Error bars are not news.

10. Don’t provide any links to the original paper.

If possible, avoid providing any easy way for readers (in particular, scientists) to access the original peer-reviewed article on which your story is based. Some techniques to delay reading of the primary paper are to not provide the title or to have your press release come out months before the article is set to appear. An excellent example, which also combines many of the points above, is available here.

This list is not complete, but it should suffice as a rough guide to writing truly awful science news stories.