Endogenous retroviruses and human transcriptional networks.

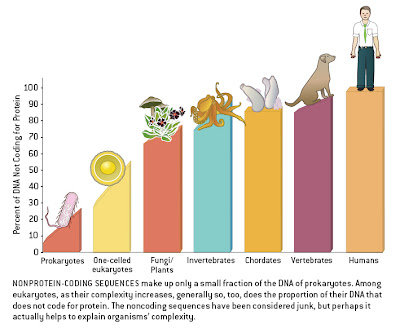
The human genome, like that of most eukaryotes, is dominated by non-coding DNA sequences. In humans, protein-coding exons constitute only about 1.5% of the total DNA sequence. The rest is made up of non-coding elements of various types, including pseudogenes (both classical and processed), introns, simple sequence repeats (microsatellites), and especially transposable elements — sequences capable of autonomous or semi-autonomous movement around, and in most cases duplication within, the genome. Endogenous retroviruses (ERVs), which are very similar to or indeed are classified as long terminal repeat (LTR) retrotransposons, represent one type of transposable element within Class I (elements that use an RNA intermediate during transposition; Class II elements transpose directly from DNA to DNA by cut-and-paste mechanisms). Roughly 8% of the human genome is represented by ERVs, which are descendants of former exogenous retroviruses that became incorporated into the germline genome.

It seems that no discussion about non-coding DNA is complete without stating that until recently it was all dismissed as useless junk. This claim is demonstrably false, but that does not render it uncommon. Some scientists did indeed characterize non-coding DNA as mostly useless, but finding references to this effect that do not also make explicit allowances for potential functions in some non-coding regions is challenging. Even authors such as Ohno and Comings, who first used the term “junk DNA”, noted that this did not imply a total lack of function. In fact, for much of the early period following the discovery of non-coding DNA, there was plentiful speculation about what this non-coding DNA must be doing — and it must be doing something, many authors argued, or else it would have been eliminated by natural selection. (Hence the fallacy involved in claiming that “Darwinism” prevented people from considering functions for non-coding regions within the genome).

Some authors rejected this automatic assumption of function, and argued instead that mechanisms of non-coding DNA accumulation — such as the accretion of pseudogenes following duplication (“junk DNA” sensu stricto) or insertions of transposable elements (“selfish DNA”) — could account for the presence of so much non-coding material without appeals to organism-level functions. However, the originators of such ideas often were careful to note that this did not preclude some portions of non-coding DNA from taking on functions, especially in gene regulation [Function, non-function, some function: a brief history of junk DNA].

There are lots of examples of particular transposable elements, which probably began as parasitic sequences, becoming co-opted into integral roles within the host genome. This process has played an important role in several major transitions during the macroevolutionary history of lineages such as our own. There is a large and growing literature on this topic, but reviewing this is beyond the scope of this post (see chapter 11 in The Evolution of the Genome for some examples). The present post will focus on only one recent case that was published this month in the Proceedings of the National Academy of Sciences of the USA by Ting Wang, David Haussler, and colleagues which focuses on the role of ERVs in the evolution of a key human gene regulatory system.

Here is the abstract from their paper (which is open access and is available here):

Species-specific endogenous retroviruses shape the transcriptional network of the human tumor suppressor protein p53

The evolutionary forces that establish and hone target gene networks of transcription factors are largely unknown. Transposition of retroelements may play a role, but its global importance, beyond a few well described examples for isolated genes, is not clear. We report that LTR class I endogenous retrovirus (ERV) retroelements impact considerably the transcriptional network of human tumor suppressor protein p53. A total of 1,509 of {approx}319,000 human ERV LTR regions have a near-perfect p53 DNA binding site. The LTR10 and MER61 families are particularly enriched for copies with a p53 site. These ERV families are primate-specific and transposed actively near the time when the New World and Old World monkey lineages split. Other mammalian species lack these p53 response elements. Analysis of published genomewide ChIP data for p53 indicates that more than one-third of identified p53 binding sites are accounted for by ERV copies with a p53 site. ChIP and expression studies for individual genes indicate that human ERV p53 sites are likely part of the p53 transcriptional program and direct regulation of p53 target genes. These results demonstrate how retroelements can significantly shape the regulatory network of a transcription factor in a species-specific manner.

The TP53 gene is a “master control gene” — a sequence whose product (“protein 53”, or “p53“) is a transcription factor that binds to DNA and regulates the expression of other genes, including ones involved in DNA repair, cell cycle regulation, and programmed cell death (apoptosis). It is so important that it has been dubbed “the guardian of the genome”. Mutations in this gene can be highly detrimental: the “T” in TP53 stands for tumor, and mutations in this gene are often associated with cancers. This includes many smoking-related cancers.

The authors of this study report that particular ERVs contain sites to which the p53 protein binds. As a result of past retrotransposition, these ERVs tend to be distributed in various locations in the genome. This makes it possible for the p53 protein to bind not just at one site, but at sites dispersed in different regions, and therefore in proximity to a variety of other genes. It is this distributed network of binding sites that allows p53 to regulate so many other genes in its role as genome guardian. And this is only possible because an ERV with a site to which the p53 protein is capable of binding inserted into the genome of an early primate ancestor some 40 million years ago, made copies of itself throughout the genome, and then became useful as a source of binding sites. This is classic co-option (exaptation) at the genomic level, and represents the very same kind of explanation that Darwin himself offered for the evolution of complex structures at the organismal scale.

While this is a truly interesting discovery that sheds even more light on the complex history of the genome, it also highlights some important points that I have tried to make on this blog. First, this applies to only a fraction of non-coding DNA. Only about 8% of the genome is made up of ERVs, and, of these, only 1,509 of 319,000 copies (0.5%) include the relevant binding site. About 90% of the ERVs are represented only by “solo LTRs”, the long repeats at the end that remain after the rest of the element was deleted. Moreover, several ERVs have been implicated in autoimmune diseases. Thus, not only is only a small fraction likely to be involved in gene regulatory networks such as that of TP53, others are clearly maladaptive from the perspective of the host genome.

The evolution of the genome is a complex process involving multiple types of elements and interactions at several levels of organization. While very few authors ever claimed that all non-coding DNA was totally without function, it is certainly the case that non-coding sequences are worthy of the new-found attention that they have received from the genomics community. Let us hope that this will include more integration with evolutionary biology than has been evident in the past, as it clearly requires an appreciation of both complexity and history.

_________

ps: The press release from UC Santa Cruz by Karen Schmidt is quite good (notwithstanding the mandatory “it was dismissed as junk” line).


Genomicron discovers Adaptive Complexity, and likes it.

Via Panda’s Thumb, I have come across a blog that I wish I had known about sooner. It is Adaptive Complexity by Michael White, postdoc in the Department of Genetics and the Center for Genome Sciences at the Washington University School of Medicine, who is also a featured writer at Scientific Blogging (some readers may recall that I was invited to be a featured writer, but I ultimately decided not to commit due to time constraints).

In any case, Adaptive Complexity provides some good posts, and expresses some of the same frustrations as I do, about non-coding DNA. Some highlights:

Welcome to my blogroll and feed reader, Dr. White.


Proof that introns are functional… come again?

I use Google Reader to aggregate not just blogs but science news, journal contents, and index searches. The feed for my weekly PubMed search turned up a real doozy. The record had been deleted by the time I got to PubMed, although I did manage to track it down.

Check this one out, it’s the zaniest abstract I have seen in some time:

The Genomic Structure: Proof of the Role of Non-Coding DNA
Bouaynaya, N. Schonfeld, D.

Engineering in Medicine and Biology Society, 2006. EMBS ’06. 28th Annual International Conference of the IEEE, Aug. 2006, pp. 4544-4547.

We prove that the introns play the role of a decoy in absorbing mutations in the same way hollow uninhabited structures are used by the military to protect important installations. Our approach is based on a probability of error analysis, where errors are mutations which occur in the exon sequences. We derive the optimal exon length distribution, which minimizes the probability of error in the genome. Furthermore, to understand how can Nature generate the optimal distribution, we propose a diffusive random walk model for exon generation throughout evolution. This model results in an alpha stable exon length distribution, which is asymptotically equivalent to the optimal distribution. Experimental results show that both distributions accurately fit the real data. Given that introns also drive biological evolution by increasing the rate of unequal crossover between genes, we conclude that the role of introns is to maintain a genius balance between stability and adaptability in eukaryotic genomes. (Emphasis added, in case that didn’t leap out at you already).

There you have it. Introns are ingenious decoy targets, and some fancy math PROVED it. As if a few pages of equations weren’t enough, they even provided a basic analysis of exon sizes in three species — and one wasn’t even a mammal. Sadly, no Dappers though.


Dog’s Ass Plots (DAPs).

The word logodaedaly means “a capricious coinage of words”. It was coined by Plato in the 4th century BC (as “wordsmith”) and picked up by Ben Johnson in 1611 in its current English usage. That’s right, someone coined a term for the process of coining terms.

Sometimes new terms are very useful. Every profession has its own jargon, which for the most part helps experts to save time by having individual terms for specific items or ideas. On the other hand, the original meaning can be lost and the term can be badly misunderstood or misapplied when it moves from jargon to buzzword. “Junk DNA” is a case in point. Other terms may be coined to give a simple summary of a more complex idea. “The Onion Test” is an example: it’s not really about onions, but about providing a reminder that there is more diversity out there than one might otherwise have considered.

Finally, sometimes terms are coined just for fun. This is one of those times.

Several bloggers have drawn attention to the persistent assumption expressed by some authors that humans are the pinnacle of biological complexity, as reflected in certain graphical representations relating to non-coding DNA [Pharyngula, Sandwalk, Sunclipse, Genomicron]. Larry Moran’s discussion pointed to what must be the single worst figure of the genre, from an article in Scientific American. This figure forms the basis of a new term that I wish to coin.

Here is the figure in question:


In a previous post, I complained about the ridiculous division of groups (humans are vertebrates and vertebrates are chordates), the lack of labels on the X-axis, the ambiguous definition of “complexity” implied, and the blatant assumption, sans justification, that humans are the most complex organisms around.

I also noted the following issue:

The sloping of the bars within taxa suggests that this is meant to imply a relationship between genome size and complexity within groups as well, with the largest genomes (i.e., the most non-coding DNA) found in the most complex organisms. This would negate the goal of placing humans at the extreme, as our genome is average for a mammal and at the lower end of the vertebrate spectrum (some salamanders have 20x more DNA than humans). Indeed, the human datum would accurately be placed roughly below the dog’s ass in this figure if it included a proper sampling of diversity.

As a result, I hereby propose that all such figures, with unlabeled axes and clear yet unjustified assumptions about complexity, henceforth be dubbed “Dog’s Ass Plots”. “DAPs” or “Dappers” also are acceptable, as in “I’m surprised that the reviewers didn’t pick up on this DAP” or “Check out this figure, it’s a real Dapper”. (As an added bonus, “dapper” means “neat and trim” — which these figures certainly are; the problem is not that they don’t look slick, it’s that they are oversimplified).

I have no doubt that plenty of examples can be found in subjects besides genomics, so please feel free to use it as needed in your own field.


Worst figure of all.

Larry Moran has provided a good discussion of complexity and genome size, and of the confusions that surround their relationship — rather, their lack of a relationship — to one another [Genome size, complexity, and the C-value paradox]. He links to my earlier story about figures that provide a misleading suggestion of a link between complexity and genome size, and in the process he tops the figure I mentioned [What’s wrong with this figure? see also Genome size and gene number]. In fact, the one he notes is easily the worst one I have ever seen like this, for all kinds of reasons. It is from a 2004 article in Scientific American by John Mattick entitled The hidden genetic program of complex organisms.

Where does one begin? For one thing, humans are vertebrates and vertebrates are chordates, so this is just downright ridiculous. “Invertebrates” is paraphyletic as echinoderms are more closely allied to vertebrates than to other non-vertebrate animals. Some fungi are single-celled, and some people consider unicellular algae to be plants. The X-axis in these figures is never labeled, but the obvious implication is that it represents an increasing scale of “complexity”. It is probably unlabeled because otherwise one would have to provide units of complexity, and I doubt that would be straightforward at all. It certainly would be a challenge to justify ranking humans as more complex than dogs — I can not think of any way that one could defend such a position objectively. The sloping of the bars within taxa suggests that this is meant to imply a relationship between genome size and complexity within groups as well, with the largest genomes (i.e., the most non-coding DNA) found in the most complex organisms. This would negate the goal of placing humans at the extreme, as our genome is average for a mammal and at the lower end of the vertebrate spectrum (some salamanders have 20x more DNA than humans). Indeed, the human datum would accurately be placed roughly below the dog’s ass in this figure if it included a proper sampling of diversity.

__________

Updates:

  • An astute, anonymous, commenter has pointed out a further distortion, namely that the disparate heights of the various organisms causes the eye to artificially exaggerate the differences among the bars.
  • This figure has led to the coining of a new term .


Junk DNA: let me say it one more time.

Let me say it one more time.

The term “junk DNA” was not coined on the basis of not knowing what it does. It was not a cop-out or a surrender. Susumu Ohno coined the term in 1972 in reference to a specific mechanism of non-coding DNA formation that he thought accounted for the discrepancies in genome size among species: gene duplication and pseudogenization. That is, a gene is duplicated and one of the copies becomes degraded by mutation to the point of being non-functional with regard to protein coding. (Sometimes the second copy takes on a new function through “neofunctionalization”, or the two copies may split the original function through “subfunctionalization”). “Junk” meant “something that was functional (a gene) but now isn’t (a pseudogene)”.

It has turned out that non-coding DNA is far more complex than just pseudogenes. It also includes transposable elements, introns, and highly repetitive sequences (e.g., microsatellites). For the most part, the mechanisms by which these form are reasonably well understood, and as a result there is good reason to expect that many or even most of them are not functional for the organism. Many authors argue that most non-coding DNA is non-functional, not because of a lack of imagination, but on the basis of a large amount of information regarding its mechanisms of accumulation.

Some non-coding DNA is proving to be functional, to be sure. Gene regulation, structural maintenance of chromosomes, alternative splicing, etc., all involve sequences other than protein-coding exons. But this is still a minority of the non-coding DNA, and there is always the issue of the onion test when considering all non-coding DNA to be functional.

And finally, it needs to be pointed out again that evolutionary biologists and geneticists held a variety of views on functionality, some claiming that it was all functional, some saying very little (but few, if any, saying it was all totally non-functional). Strict adaptationist (“ultra-Darwinian”) thinking had led many authors to assume that non-coding DNA must be doing something useful or it would have been eliminated by selection long ago. The proponents of the “selfish DNA” approach to non-coding DNA wrote their papers in direct response to this overly adaptationist interpretation and argued that much of it could be explained simply by the existence of mechanisms that put it there, independent of organism-level function. But even they expected that some would turn out to play a role in regulation. At the same time, most researchers for the past half century have noted the link between DNA amount and cell size, which means that total non-coding DNA content is not irrelevant biologically. This could, however, be an effect instead of a function, which is why there has for decades been discussion about this issue.

You can tell someone who knows very little about the science or history of “junk DNA” when they make one or more of the following claims: 1) All scientists have always thought it was all totally irrelevant to the organism. 2) New evidence is suggesting that it is all functional. 3) “Darwinism” led to the assumption that non-coding DNA is non-functional. The opposite is true in each case.

One can discuss possible functions for non-coding DNA — that’s not a problem, and it makes for an interesting topic if data are used to back up claims — but please stop distorting the views of scientists both past and present in the process.

___________

See also


Genome size and gene number.

In a previous discussion [What’s wrong with this figure?], I noted that certain things seem to happen with disturbing frequency in discussions of genome size. The first is the invocation of pre-Darwinian “Great Chain of Being” thinking, in which humans are considered the most complex organisms, with all others ranked at lower positions on the scala naturae. Of course, this is not restricted to genomics — one can find references to “lower vertebrates”, “subhuman primates”, or “higher plants” peppered throughout the scientific literature. The second issue is the exclusive use of genome sequence data in discussions of genome size diversity. This is problematic because, with few exceptions, sequencing targets are selected in large part on the basis of having small and manageable genomes. I receive many requests from colleagues to provide genome size estimates, and the hope is always that they will turn out to be small such that they will have a chance of being adopted as a sequencing model. There are obvious pragmatic reasons for this, but it means that one must be careful about interpreting data from an inherently biased set of data.

The previous discussion focused on examples in which authors have tried to demonstrate a link between the amount of non-coding DNA and organismal complexity, by making both of the mistakes outlined above. In this post, I want to discuss the opposite but equally aggravating problem, which is using these same limited data to demonstrate an association between genome size and gene number.

Every now and then, an author makes the claim that gene number and genome size actually are correlated, despite this having been rejected decades ago when the first broad comparisons of genome size were made and the various sorts of non-coding DNA were discovered. The most recent example comes from Lynch (2006):

The same figure appears in Lynch (2007). Click for larger view.

There are two problems that I see with this figure. The first is that it lumps together viruses, bacteria, and eukaryotes. Although Lynch (2006, 2007) argues that there is a smooth continuum between the parameters across these taxonomic boundaries, and thus that there is no difficulty when combining these data, I would suggest that the very different genomic properties of these groups should be cause for questioning this approach. For example, it is well known that gene number and genome size are strongly correlated among “prokaryotes”, because they generally exhibit a paucity of non-coding DNA. This means that including them anchors the correlation at the bottom end.

Genome size is strongly related to gene number in both archaea and bacteria. Figure from Gregory and DeSalle (2005). Click for larger view.

The second problem is, obviously, that this is based on a selective set of species. An estimate of gene number is best achieved with a genome sequence, but genome sequences typically are available only for small genomes. If one assumes that most species in a given group (say, a phylum) have roughly similar gene numbers and plots the actual diversity of genome size (e.g., mean for that phylum), the relationship is nowhere near as clear. Indeed, it drops off completely.

From Gregory (2005). Click for larger view.

In fact, you can see this happening already in Lynch’s (2006, 2007) figure. Note that there is a totally flat line for the animal data, even though these come from species with comparatively modest genome sizes. Since I work on animals (whose genome sizes range 3,300-fold), I would say that there is no relationship between genome size and gene number in my group. If you compare animals to bacteria, then there is such a relationship, of course, but that almost goes without saying, and could relate to differences in chromosome structure as much as anything else.

The point is that genome sequencing data are extremely useful, including in discussions of genome size, but that they, like all data, must be interpreted within their proper context. Genome sequencing models, at least at the moment, do not encompass the diversity that exists among eukaryotes. In fact, even with 10,000 species in the various databases [animals, plants, fungi], the current dataset of eukaryotic genome size diversity itself is far from comprehensive.

The diversity of archaeal, bacterial, and eukaryotic genome sizes as currently known from more than 10,000 estimates. From Gregory (2005). Click for larger view.

What is clear, and has been for decades, is that genome size evolves independently of organismal complexity and gene number (which themselves may evolve more or less independently of one another). This makes it a very intriguing puzzle to study, one that has resisted all attempts at one-dimensional explanation for over half a century.

___________

References

Gregory, T.R. 2005. Synergy between sequence and size in large-scale genomics. Nature Reviews Genetics 6: 699-708.

Gregory, T.R. and DeSalle, R. 2005. Comparative genomics in prokaryotes. In: The Evolution of the Genome, edited by T.R. Gregory, pp. 585-675. Elsevier, San Diego, CA.

Lynch, M. 2006. Streamlining and simplification of microbial genome architecture. Annual Review of Microbiology 60: 327-349.

Lynch, M. 2007. The Origins of Genome Architecture. Sinauer Associates, Sunderland, MA.

See also


What’s wrong with this figure?

There is a story on Science News Online entitled “Genome 2.0“. The author has certainly done a lot of legwork and has tried to present a detailed discussion of a complex topic, and for that he deserves considerable credit. (He clearly hasn’t taken my guide to heart). That said, it is unfortunate that the author has fallen into the trap of repeating the usual claims about the history (everyone thought it was merely irrelevant garbage) and potential function (some is conserved and lots is transcribed, so it all must be serving a role) for “junk DNA”. As a result, I won’t comment much more on it. One thing that may be relevant to point out about this story in particular is the first figure it uses. This is a figure I have seen in a few places, including in the scientific literature. It makes me cringe every time because it reveals a real problem with how some people approach the issue of non-coding DNA. And so, 10 points to the first person who can point out what is deeply problematic about the interpretation it is often granted. I include the legend as provided in the original report.

JUNK BOOM. Simpler organisms such as bacteria (blue) have a smaller percentage of DNA that doesn’t code for proteins than more-complex organisms such as fungi (grey), plants (green), animals (purple), and people (orange).


(See also Genome size and gene number)
________________


Update:

The 10 points has been awarded twice on the basis of two major problems being pointed out.

The first is that the graph arranges species according to % noncoding DNA and assumes that everyone will agree that the X-axis proceeds from less to more complex. This is classic “great chain of being” thinking. No criteria are specified by which the bacteria are ranked (and it is simply ignored that Rickettsia has a lot of pseudogenes which appear to be non-functional), which is bad enough. Worse yet, there is really no justification for ranking C. elegans as more complex than A. thaliana other than the animal-centric assumption that all animals must be more sophisticated than all plants.

The second, and the one I had in mind, is that this is an extremely biased dataset. Specifically, it is based on a set of species whose genomes have been sequenced. These target species were chosen in large part because they have very small genomes with minimal non-coding DNA. The one exception is humans, which was chosen because we’re humans. As has been pointed out, even if you chose a few of the more recently sequenced genomes (say, pufferfish at 400Mb and mosquito at 1,400Mb) this pattern would start to disintegrate. If you look at the actual ranges or means of genome size among different groups, you will see that there are no clear links between complexity and DNA content, despite what some authors (who focus only on sequenced genomes) continue to argue.

To illustrate this point, this figure shows the means (dots) and ranges in genome size for the various groups of organisms for which data are available. This represents estimates for more than 10,000 species. This is intentionally arranged along the same kind of axis of intuitive notions of complexity just to show how discordant “complexity” and genome size actually are. Humans, it will be noted, are average in genome size for mammals and not particularly special in the larger eukaryote picture.

Means and ranges of haploid DNA content (C-value) among different groups of organisms. Click for larger image. Source: Gregory, TR (2005). Nature Reviews Genetics 6: 699-708.

Maybe you will join me in cringing the next time you see a figure like the one in the story above.

Update (again):

Others have criticized this kind of figure before. As a case in point, see John Mattick’s (2004) article in Nature Reviews Genetics and the critical commentary by Anthony Poole (and Mattick’s reply). Obviously, I am with Poole on this one.

Ultraconserved non-coding regions must be functional… right?

Whereas the possibility that non-coding DNA is functional has been a topic of discussion for decades, it recently has come to the fore with the availability of several sequenced genomes which allow signs of function to be detected at the DNA level. The multi-million-dollar ENCODE project is the largest initiative focused on identifying functional elements in the human genome, but many smaller projects are also ongoing in other species such as mice, Drosophila, and other eukaryotes (e.g., Siepel et al. 2005).

For the most part, the way that potentially functional elements are highlighted is by finding regions of the genome that are essentially unchanged among species whose lineages have been separated for very long periods of time. No change in the sequences suggests that they have been preserved in their present state by natural selection — that is, individuals with mutations in these regions were less fit, and only those with no such changes have left an unbroken line of descendants to the present day. A recent analysis by Katzman et al. (2007) in Science indicated that indeed these “ultraconserved” regions are “ultraselected” in the human genome. Because natural selection is the result of differential survival and reproduction due to heritable phenotypic differences, this provides strong evidence that these regions have some important effect — in fact, probably a function — on the organisms carrying them.

It is important to note that elements exhibiting signs of selective constraint make up a small fraction of the total genome of organisms like mammals, on the order of 5%. Ultraconserved elements in particular represent a very tiny portion of the total DNA. It would therefore be a major exaggeration to assume that the demonstration of such sequences implies that all non-coding DNA is functional. Most or all of it might serve a function, but there is no evidence to support this notion at present. It is also inaccurate to suggest that the discovery of some function in non-coding DNA is a total surprise. Even the early proponents of the “selfish DNA” view of non-coding DNA evolution proposed that some elements would end up being functional, most notably in gene regulation. This certainly appears to have been borne out, and it is quite plausible that more than just the ultraconserved elements are involved in the regulation of coding genes.

However, amidst this backdrop of increasingly refined tabulations of conserved elements in animal genomes there are some observations that raise doubts about just how important they are for organismal fitness. In 2004, for example, Marcelo Nóbrega and colleagues put the importance of conserved non-coding DNA to the test — by deleting some of it. Specifically, they removed two fragments of conserved DNA totaling 1,511 kilobases and 845kb in mice and observed the consequences. Or, more accurately, the lack of consequences. In their experiment, the deletion of more than 2 million base pairs of conserved DNA from the mouse genome had no identifiable effects on the development, physiology, or reproduction of the subjects.

Of course, the mice were kept in lab conditions, and it was argued by some that this may be an unrealistic test given that conditions in the wild are much harsher and any detriment to growth or survival may be hidden in the lab.

In the September 2007 issue of the open access journal PLoS Biology, Nadav Ahituv and coworkers report on a similar but more telling experiment, again using deletions of ultraconserved DNA elements in mice. In this case, the authors deleted four elements ranging in length from 222 to 731bp in ultraconserved regions that are invariant among humans, mice, and rats. More importantly, these regions are known to be located in close proximity to genes for which loss of function mutations result in severe abnormalities.

(List of genes adjacent to ultraconserved elements. Click for larger image)


The assumption, therefore, was that if these regions are conserved because they regulate nearby genes, then their removal should disrupt gene function and result in inviable mice. What did they find?

Nothing. No effect whatsoever was detectable in terms of growth, morphology, reproduction, metabolism, or longevity when any of the four elements was deleted. Again, it is possible that some deleterious effect would show up in the wild, or that there is redundancy that allows other elements to regulate these genes if need be, but as far as the expected phenotypic consequences of disrupting the nearby genes goes, it makes no difference whether these specific conserved sequences are present or not.

At the moment, there is no conclusive evidence one way or another as to the function of most non-coding DNA. It bears noting, however, that although it is very difficult to demonstrate that so much non-coding DNA is non-functional (as this is roughly akin to proving a universal negative), there are reasons to adopt this as the default hypothesis. For example, several mechanisms are known that can generate large amounts of non-coding DNA independent of organismal functions. On the other hand, the evidence for function is thus far restricted to a few percent of the genome, and even here it appears that some of these elements can be eliminated without obvious consequences.

This is not to say that non-coding DNA has no effect; it clearly influences cell size and cell division rate, for example. It is, however, far outstripping the available evidence, and contradicting much of what is already known about genome evolution, to argue that comparative genomics is revealing functions for non-coding DNA at large. At most, genomic analysis is showing genome form, function, and evolution to be much too complex to support any inflexible assumptions on either side.

___________

References

Ahituv, N. et al. (2007). Deletion of ultraconserved elements yields viable mice. PLoS Biology 5(9): e234.

ENCODE Project Consortium (2007). Identification and analysis of functional elements in 1% of the human genome by the ENCODE pilot project. Nature 447: 799-816.

Gross, L. (2007). Are “ultraconserved” genetic elements really indispensable?. PLoS Biology 5(9): e23.

Katzman, S. et al. (2007). Human genome ultraconserved elements are ultraselected. Science 317: 915.

Nobrega, M.A. et al. (2004). Megabase deletions of gene deserts result in viable mice. Nature 431: 988-993.

Siepal, A. et al. (2005). Evolutionarily conserved elements in vertebrate, insect, worm, and yeast genomes. Genome Research 15: 1034-1050.

___________

Update:

Larry Moran has a nice piece on this at Sandwalk. There is also a post about it at This Week in Evolution. Kay of Suicyte (great title — he works on apoptosis) has an interesting post as well. And for goodness sake, could someone please go read Chris Harrison’s earlier post on Interrogating Nature so he can’t stop the crank-like self promotion in all the discussion threads? (Just kidding, Chris –it’s a nice post).


An opportunity for ID to be scientific.

Intelligent design proponents claim to base their views entirely on scientific data, and argue that the design perspective is more productive than an evolutionary approach. One area where this is particularly evident is in discussions of “junk DNA”. Indeed, with every new discovery (by evolutionary biologists) that some part of the genome shows signs of function, ID proponents suggest that it is they, and not evolutionary biologists, who predicted from the outset that non-coding DNA would prove to be functional. I won’t repeat the discussion of why it is incorrect to suggest that most biologists have stubbornly refused to consider functions for non-coding DNA (see here and here). Instead, what I want to do is to give ID proponents an opportunity to show that their perspective really is scientific and that it can lead to a better description and explanation for biological phenomena than evolutionary science can.

Here is what ID proponents need to do:

1) Specify the basis for assuming that all non-coding DNA must be functional. This makes implicit assumptions about the designer and the design process (namely, that he/she/it would not produce non-functional features of organisms). This assumption must be justified. It also opens the discussion to more philosophical questions, such as why the designer would choose to design such a massive number of pathogens and parasites. Either one can know the designer’s plan or one cannot; if the former, then the way that one would come to know this must be explicated.

2) Specify how one would go about demonstrating evidence of functions for non-coding DNA in the absence of a framework based on common descent. To date, most evidence for function comes from demonstrations of conservation of non-coding sequences, which indicates that constraints imposed by natural selection have maintained these sequences over long spans of evolutionary time. ID would need to propose a testable means of identifying functional sequences that does not rely on the assumption of common descent. Also, it should be recalled that, at present, there is suggestive evidence that about 5% of the human genome is functional. It will be necessary to specify how function will be demonstrated in the other 95% of the genome.

3) Make specific predictions about what function(s) all non-coding DNA is likely to be fulfilling, and propose ways to test those predictions. A vague prediction that all non-coding DNA will prove to be functional is not useful. Moreover, strict Darwinian theory in which natural selection is assumed to remove any non-functional features makes exactly the same prediction, so this does not distinguish ID from Darwinian theory.

4) Propose functions for transposable elements that take into account their parasitic characteristics (e.g., as disease-causing mutagens) but do not invoke the notion of co-option. There are clear examples of transposable elements (TEs) that are functional, for example as regulatory sequences, in the vertebrate immune system, and in cellular stress response. However, this represents a very small percentage of TEs, most of which are neutral or deleterious in the genome. The evolutionary explanation is that, in some relatively rare cases, these former parasites have become integrated into the functional system of the genome. This process of co-option of function is the same process that evolutionary biologists use in explanations of the evolution of complex structures such as eyes or flagella. If co-option is ruled out a priori, then it cannot be used to explain the acquisition of function of formerly parasitic elements and a different explanation must be provided.

5) Provide a specific explanation for how the great majority of transposable elements in the human genome can be functional while showing clear signs of being inactive. Most TEs in the human genome have experienced mutations in regions that render them incapable of undergoing transposition. Many are so degraded by mutation as to be hardly recognizable. How these highly mutated elements carry out a specific function needs to be explained.

6) Provide an explanation for why the DNA sequences of non-coding regions in different species appear to correspond to degree of relatedness. If species do not share common ancestors, then an alternate explanation is required for why species that are claimed to be close relatives exhibit similar sequences whereas those that are claimed to be more distant relatives possess DNA sequences that are not as similar.

7) Propose a testable explanation for why similar species may have widely different quantities of non-coding DNA in their genomes. A simple example is provided by onions and members of the same genus.

8) If one does accept common descent, propose a testable explanation for how there can be significant reductions in DNA content in some lineages. There is evidence that many lineages have experienced losses of non-coding DNA. For example, the evolution of saurischian dinosaurs appears to have included a reduction in DNA amount. How this loss of DNA could occur requires explanation under the assumption that all non-coding DNA in the ancestor’s genome was functional.

More could be added to such a list, but I suspect that this will be enough to provide ID proponents with a prime opportunity to demonstrate their scientific credibility.