What’s wrong with this figure?

There is a story on Science News Online entitled “Genome 2.0“. The author has certainly done a lot of legwork and has tried to present a detailed discussion of a complex topic, and for that he deserves considerable credit. (He clearly hasn’t taken my guide to heart). That said, it is unfortunate that the author has fallen into the trap of repeating the usual claims about the history (everyone thought it was merely irrelevant garbage) and potential function (some is conserved and lots is transcribed, so it all must be serving a role) for “junk DNA”. As a result, I won’t comment much more on it. One thing that may be relevant to point out about this story in particular is the first figure it uses. This is a figure I have seen in a few places, including in the scientific literature. It makes me cringe every time because it reveals a real problem with how some people approach the issue of non-coding DNA. And so, 10 points to the first person who can point out what is deeply problematic about the interpretation it is often granted. I include the legend as provided in the original report.

JUNK BOOM. Simpler organisms such as bacteria (blue) have a smaller percentage of DNA that doesn’t code for proteins than more-complex organisms such as fungi (grey), plants (green), animals (purple), and people (orange).


(See also Genome size and gene number)
________________


Update:

The 10 points has been awarded twice on the basis of two major problems being pointed out.

The first is that the graph arranges species according to % noncoding DNA and assumes that everyone will agree that the X-axis proceeds from less to more complex. This is classic “great chain of being” thinking. No criteria are specified by which the bacteria are ranked (and it is simply ignored that Rickettsia has a lot of pseudogenes which appear to be non-functional), which is bad enough. Worse yet, there is really no justification for ranking C. elegans as more complex than A. thaliana other than the animal-centric assumption that all animals must be more sophisticated than all plants.

The second, and the one I had in mind, is that this is an extremely biased dataset. Specifically, it is based on a set of species whose genomes have been sequenced. These target species were chosen in large part because they have very small genomes with minimal non-coding DNA. The one exception is humans, which was chosen because we’re humans. As has been pointed out, even if you chose a few of the more recently sequenced genomes (say, pufferfish at 400Mb and mosquito at 1,400Mb) this pattern would start to disintegrate. If you look at the actual ranges or means of genome size among different groups, you will see that there are no clear links between complexity and DNA content, despite what some authors (who focus only on sequenced genomes) continue to argue.

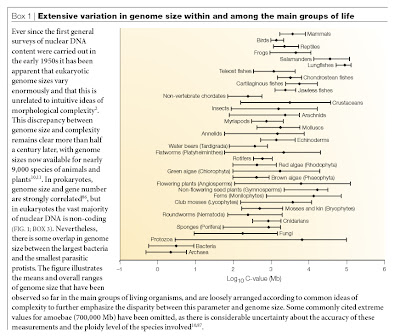
To illustrate this point, this figure shows the means (dots) and ranges in genome size for the various groups of organisms for which data are available. This represents estimates for more than 10,000 species. This is intentionally arranged along the same kind of axis of intuitive notions of complexity just to show how discordant “complexity” and genome size actually are. Humans, it will be noted, are average in genome size for mammals and not particularly special in the larger eukaryote picture.

Means and ranges of haploid DNA content (C-value) among different groups of organisms. Click for larger image. Source: Gregory, TR (2005). Nature Reviews Genetics 6: 699-708.

Maybe you will join me in cringing the next time you see a figure like the one in the story above.

Update (again):

Others have criticized this kind of figure before. As a case in point, see John Mattick’s (2004) article in Nature Reviews Genetics and the critical commentary by Anthony Poole (and Mattick’s reply). Obviously, I am with Poole on this one.

Hooray for HuRef! J. Craig Venter’s genome sequenced.

The first diploid human genome sequence, and the first truly complete sequence from a single individual — notably but perhaps not surprisingly Dr. J. Craig Venter — is now available. The paper describing Dr. Venter’s genome (which has been labeled “HuRef”) is published in the open access journal PLoS Biology, so feel free to take a look.

Previous sequences for the “human genome” represented composites from multiple individuals [Whose genome?] and were haploid. As a result, it was not possible to determine the extent of intragenomic variation or the degree to which the two copies of a genome in a diploid organism — one derived from the father, one from the mother — interact with one another. The availability of this new sequence opens several new possibilities for detailed analysis, in addition to ushering in the era of personal genomics.

As Venter said,

Each time we peer deeper into the human genome we uncover more valuable insight into our intricate biology. With this publication we have shown that human to human variation is five to seven-fold greater than earlier estimates proving that we are in fact more unique at the individual genetic level than we thought. It is clear however that we are still at the earliest stages of discovery about ourselves and only with additional sequencing of more individual genomes will we garner a full understanding of how our genes influence our lives.

Dr. James Watson, co-deducer of the double helix structure of the DNA molecule and Nobel Prize winner, also had his genome sequenced this year.

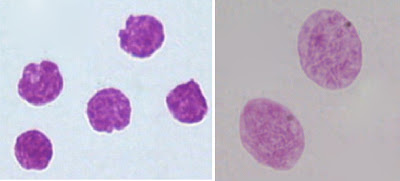
I would be happy to donate a sample of DNA if they need a third genome for comparative analysis. I note that my genome, or at least pictures of my nuclei, has been published before:

Leukocytes? Buccal epithelia? I got what you need.

As a side note, Heather Kowalski at the JCVI has provided a superb example of an informative and effective press release.


Function, non-function, some function: a brief history of junk DNA.

It is commonly suggested by anti-evolutionists that recent discoveries of function in non-coding DNA support intelligent design and refute “Darwinism”. This misrepresents both the history and the science of this issue. I would like to provide some clarification of both aspects.

When people began estimating genome sizes (amounts of DNA per genome) in the late 1940s and early 1950s, they noticed that this is largely a constant trait within organisms and species. In other words, if you look at nuclei in different tissues within an organism or in different organisms from the same species, the amount of DNA per chromosome set is constant. (There are some interesting exceptions to this, but they were not really known at the time). This observed constancy in DNA amount was taken as evidence that DNA, rather than proteins, is the substance of inheritance.

These early researchers also noted that some “less complex” organisms (e.g., salamanders) possess far more DNA in their nuclei than “more complex” ones (e.g., mammals). This rendered the issue quite complex, because on the one hand DNA was thought to be constant because it’s what genes are made of, and yet the amount of DNA (“C-value”, for “constant”) did not correspond to assumptions about how many genes an organism should have. This (apparently) self-contradictory set of findings became known as the “C-value paradox” in 1971.

This “paradox” was solved with the discovery of non-coding DNA. Because most DNA in eukaryotes does not encode a protein, there is no longer a reason to expect C-value and gene number to be related. Not surprisingly, there was speculation about what role the “extra” DNA might be playing.

In 1972, Susumu Ohno coined the term “junk DNA“. The idea did not come from throwing his hands up and saying “we don’t know what it does so let’s just assume it is useless and call it junk”. He developed the idea based on knowledge about a mechanism by which non-coding DNA accumulates: the duplication and inactivation of genes. “Junk DNA,” as formulated by Ohno, referred to what we now call pseudogenes, which are non-functional from a protein-coding standpoint by definition. Nevertheless, a long list of possible functions for non-coding DNA continued to be proposed in the scientific literature.

In 1979, Gould and Lewontin published their classic “spandrels” paper (Proc. R. Soc. Lond. B 205: 581-598) in which they railed against the apparent tendency of biologists to attribute function to every feature of organisms. In the same vein, Doolittle and Sapienza published a paper in 1980 entitled “Selfish genes, the phenotype paradigm and genome evolution” (Nature 284: 601-603). In it, they argued that there was far too much emphasis on function at the organism level in explanations for the presence of so much non-coding DNA. Instead, they argued, self-replicating sequences (transposable elements) may be there simply because they are good at being there, independent of effects (let alone functions) at the organism level. Many biologists took their point seriously and began thinking about selection at two levels, within the genome and on organismal phenotypes. Meanwhile, functions for non-coding DNA continued to be postulated by other authors.

As the tools of molecular genetics grew increasingly powerful, there was a shift toward close examinations of protein-coding genes in some circles, and something of a divide emerged between researchers interested in particular sequences and others focusing on genome size and other large-scale features. This became apparent when technological advances allowed thoughts of sequencing the entire human genome: a question asked in all seriousness was whether the project should bother with the “junk”.

Of course, there is now a much greater link between genome sequencing and genome size research. For one, you need to know how much DNA is there just to get funding. More importantly, sequence analysis is shedding light on the types of non-coding DNA responsible for the differences in genome size, and non-coding DNA is proving to be at least as interesting as the genic portions.

To summarize,

  • Since the first discussions about DNA amount there have been scientists who argued that most non-coding DNA is functional, others who focused on mechanisms that could lead to more DNA in the absence of function, and yet others who took a position somewhere in the middle. This is still the situation now.
  • Lots of mechanisms are known that can increase the amount of DNA in a genome: gene duplication and pseudogenization, duplicative transposition, replication slippage, unequal crossing-over, aneuploidy, and polyploidy. By themselves, these could lead to increases in DNA content independent of benefits for the organism, or even despite small detrimental impacts, which is why non-function is a reasonable null hypothesis.
  • Evidence currently available suggests that about 5% of the human genome is functional. The least conservative guesses put the possible total at about 20%. The human genome is mid-sized for an animal, which means that most likely a smaller percentage than this is functional in other genomes. None of the discoveries suggest that all (or even more than a minor percentage) of non-coding DNA is functional, and the corollary is that there is indirect evidence that most of it is not.
  • Identification of function is done by evolutionary biologists and genome researchers using an explicit evolutionary framework. One of the best indications of function that we have for non-coding DNA is to find parts of it conserved among species. This suggests that changes to the sequence have been selected against over long stretches of time because those regions play a significant role. Obviously you can not talk about evolutionarily conserved DNA without evolutionary change.
  • Examples of transposable elements acquiring function represent co-option. This is the same phenomenon that is involved in the evolution of complex features like eyes and flagella. In particular, co-option of TEs appears to have happened in the evolution of the vertebrate immune system. Again, this makes no sense in the absence of an evolutionary scenario.
  • Most transposable elements do not appear to be functional at the organism level. In humans, most are inactive molecular fossils. Some are active, however, and can cause all manner of diseases through their insertions. To repeat: some transposons are functional, some are clearly deleterious, and most probably remain more or less neutral.
  • Any suggestions that all non-coding DNA is functional must explain why an onion needs five times more of it than you do. So far, none of the proposed unilateral functions has done this. It therefore remains most reasonable to take a pluralistic approach in which only some non-coding elements are functional for organisms.

I realize that this will have no effect on the arguments made by anti-evolutionists, but I hope it at least clarifies the issue for readers who are interested in the actual science involved and its historical development.


Decoding the blueprint. Sigh.

The results of the proof-of-principle phase of ENCODE, the Encyclopedia of DNA Elements Project, appear in the June 14 issue of Nature. It’s a very interesting project, and it has revealed a few more surprises (or at least, added evidence in favour of previously surprising observations). I will probably post more about it soon, but for the time being let me just offer a brief apology to the science writers out there whom I have given a hard time about invoking sloppy language to describe non-coding DNA, sequencing, and genomes (recent example, but one I will leave alone, ‘Junk’ DNA makes compulsive reading online at New Scientist).

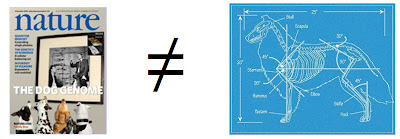
The reason I am sorry is that I simply cannot hold you to a higher standard than is maintained by one of the most prestigious journals on planet Earth. You see, Nature has decided to depict the ENCODE project on the cover as “Decoding the Blueprint”. Needless to say (again), genomes are not blueprints (as the ENCODE project shows!) and no one is decoding anything at this point.

I have said all this before, and even I am getting tired of my complaints about it. Thus, I will focus only on the interesting science in a later post.

Sigh.


Two-for-one misconceptions about genomes from the New York Times.

To date, two identified human beings have had their genomes sequenced: J. Craig Venter and James D. Watson. Venter’s was completed in draft form in 2001 and the final version was completed recently. Watson received his genome sequence on disk (a hard drive, not a DVD as reported) from Jonathan Rothberg, founder of 454 Life Sciences, at Baylor College of Medicine yesterday. You can watch the presentation here.

The notion that individual people can have their genomes sequenced (still for about $2 million, but the cost will fall precipitously in the future) is sure to elicit some interesting discussions about medical applications, ethical implications, and intriguing research into human variation. Certainly, the completion of Watson’s genome sequence has already gained media attention. Unfortunately, the same old catchphrases and errors abound. Apparently, even the mighty combined forces of Genomicron, Evolgen, and Sandwalk are insufficient to stop this.

Today, both RPM of Evolgen and Jonathan Badger at T. taxus take aim at the New York Times, who not only confuse sequencing with “deciphering”, but think that Watson discovered DNA in 1953 (Genome of DNA Discoverer Is Deciphered by Nicholas Wade).

To clarify, DNA (“nuclein”) was discovered by Friedrich Miescher in 1869. Watson and Crick elucidated the double helix structure of DNA in the 1950s, based on the results of decades of work on the chemical properties of the molecule by a large number of researchers.

I give full credit to Watson and Crick for their monumental contribution, which rightly garnered them the 1962 Nobel Prize. But credit is also due to Miescher and the countless others whose work was integral to the subsequent rise of molecular genetics and genome sequencing.

Here are two headlines announcing the same story, one inaccurate and the other fine:

Genome of DNA Discoverer is Deciphered (New York Times)

Nobel Laureate James Watson Receives Personal Genome (ScienceDaily)

Is one less catchy than the other? It seems to me that getting the history and the science right would be relatively simple and would only add to the strength of a story.

____________

Updates:

The Genetic Genealogist mentions the story and argues that Nicholas Wade may not be responsible for the headline. Fair enough — my criticism is about the entire presentation, whether that be the fault of the author, editor, or other. It does bear noting, however, that Wade has used this terminology several times previously, including describing it in the main text as the “project to sequence, or decode, the genome.”

Sandwalk has opened a discussion about whether readers would (or, like Larry, would not) want to have their genomes sequenced.

DNADirectTalk repeats the standard inaccuracies.

I don’t think we’re going to be rid of the “decoding” analogy any time soon, especially since sequencers themselves use it. Venter has a book coming out in October, with the unfortunate title A Life Decoded: My Genome: My Life. (Wouldn’t The Sequence of My Life or My Life’s Sequence have been catchier anyway?). The US Department of Energy (which financed much of the Human Genome Project) still has it on their website Human Genome Research: Decoding DNA also. To be fair to science writers, we can’t hold them to a higher standard of terminological accuracy than applies to scientists. In other words, we need to clean it up on our side first and then, hopefully, reporters will follow our lead.


Human gene number: surprising (at first) but not paradoxical.

In 2001, when the draft sequences were announced, it was revealed that the human genome contains somewhere between 30,000 and 35,000 protein-coding genes (International Human Genome Sequencing Consortium 2001; Venter et al. 2001). The completed sequence, published in 2004, provided an even lower estimate of 20,000 to 25,000 genes (International Human Genome Sequencing Consortium 2004). At present, Ensembl gives the number of protein-coding genes in the human genome as 21,724 known genes plus 1,017 novel genes. (“Known genes” correspond to an identifiable protein, “novel genes” look like they probably correspond to a protein but not yet a known one).

As I have discussed in a previous post, there is quite a bit of interest in comparisons of gene number among species. Part of the reason is that there has long been an expectation that gene number (and prior to the 1970s, genome size) should be linked to some measure of organismal complexity. More often than not, complexity is defined in such a way as to place humans at the top of the scale, but objective metrics also have been attempted. (See the excellent post entitled “Step away from that ladder” by PZ Myers for discussion on this).

Prior to the human genome sequence, the expected gene number most commonly cited was 100,000, even though lower estimates were becoming increasingly common (e.g., Aparicio 2000) and the basis of this figure was somewhat dubious to begin with. As a result, the finding of 20,000-25,000 genes in the human genome has inspired extensive commentary. Some authors even characterized this as a new “G-value paradox” or “N-value paradox”, in reference to the “C-value paradox” of yesteryear (Claverie 2001; Betrán and Long 2002; Hahn and Wray 2002).

Two questions are relevant to this topic: Is the “low” number of protein-coding genes really surprising? If so, is this “paradoxical”?

Between 2000 and 2003, a light-hearted betting pool known as “GeneSweep” was run in which genome researchers could guess at the number of genes in the human genome. A bet placed in 2000 cost $1, but this rose to $5 in 2001 and $20 in 2002 as information about the human genome sequence increased. One had to physically enter the bet in a ledger at Cold Spring Harbor, and all told 165 bets were registered. Bets ranged from 25,497 to 153,438 genes, with a mean of 61,710, as indicated by the plot below.

It has been argued that this shows that a substantial percentage of scientists expected a low gene number and were not surprised by the human gene count estimates. I interpret these data differently, for several reasons.

First, this was a betting pool, and as a result there would have been additional factors influencing the entries. For example, in a sports pool, people may assume that everyone will pick the top-ranked teams and therefore intentionally select an underdog that they hope, but do not necessarily expect, will win. If the most commonly repeated gene count estimate was 100,000 at the time, then this would be the last bet I would have placed. The decision would therefore be to either go higher or lower than this. Personally, I probably would have gone lower rather than higher, because more than 100,000 genes might be problematic due to mutational load. So, based purely on the dynamics of informed betting, I would have expected most people to pick a number substantially lower than 100,000 even if they still believed that to be the most likely number.

Second, it is important to consider when the different bets were placed (I am looking into this out of curiosity). It is entirely possible that the high values were picked first, and then lower numbers were mostly chosen later for two key reasons. One, people had to physically enter their bets at Cold Spring Harbor, so they would have seen what others were guessing and could adjust accordingly (see above). Two, new estimates came out around 2000 that put the value well above 100,000, followed by other estimates that were much closer to 40,000. If the betting trends simply tracked these data, then one could not argue that people always expected a low number. Indeed, it may be that few people would have guessed a low number until very shortly before the release of the sequence.

Third, the winning estimates were higher than the probable total by several thousand genes. (The contest ended in a three way tie, with half of the $1,200 in prize money going to Lee Rowen [who bet 25,947 in 2001] and the other half shared by Paul Dear [27,462 in 2000] and Olivier Jaillon [26,500 in 2002]; see Pennisi 2003, 2007). No one guessed too low. In fact, most entries were far above the high end of the initial draft sequence estimates of 35,000, even though betting continued for at least another year. Likewise, no estimates based on molecular data prior to the close of betting gave a value of 23,000 either.

We may also ask what genome sequencers had to say at the time. James Watson, co-discoverer of the double helix structure of DNA and the original director of the Human Genome Project, wrote the following in 2001:

Until we saw the first DNA scripts underlying multicellular existence, it seemed natural that increasing organismal complexity would involve corresponding increases in gene numbers. So, I and virtually all of my scientific peers were surprised last year when the number of genes of the fruit fly, Drosophila melanogaster, was found to be much lower than that of a less complex animal, the roundworm Caenorhabditis elegans (13,500 vs. 18,500). More shocking still was the recent finding that the small mustard plant, Arabadopsis thaliana, contains many thousand more genes (~28,000) than does C. elegans. Now we are jolted again by the conclusion that the number of human genes may not be much more than 30,000. Until a year ago, I anticipated that human existence would require 70,000-100,000 genes.

J. Craig Venter, who led the private initiatives to sequence the fruit fly and human genomes, was quoted by The Observer in 2001 as saying “When we sequenced the first genome of … the fruit fly, we found it had about 13,000 genes, and we all thought, well we are much bigger and more complicated and so we must have a lot more genes. Now we find that we only have about twice what they have. It makes it a bit difficult to explain the human constitution.” In the same piece, Venter is quoted as noting that “Certainly, it shows that there are far fewer genes than anyone imagined.”

The Human Genome Project Information page said the following in 2004: “This lower estimate came as a shock to many scientists because counting genes was viewed as a way of quantifying genetic complexity. With around 30,000, the human gene count would be only one-third greater than that of the simple roundworm C. elegans at about 20,000 genes”.

Lee Rowen, co-winner of GeneSweep, noted that her estimate was inspired by Jean Weisenbach of Genoscope, who had suggested a few years earlier that the human gene number might be low. Rowen noted that, “at the time, everybody nearly fell of their chair” upon hearing this proposition (Pennisi 2003).

The list could go on, but I think it is evident that, in the light of pre-genomic views of genetics, most scientists were surprised by the low gene count in humans, especially when compared to other species to which we intuitively attribute lesser complexity. Notably, the nematode Caenorhabditis elegans appears to possess 20,069 known and novel genes even though it consists only of ~1,000 cells, the fly Drosophila melanogaster has 14,039 genes, the sea urchin Strongylocentrotus purpuratus 23,300 on first pass, and rice Oryza sativa upwards of 50,000. I don’t know if anyone expected this pattern prior to the dawn of genome sequencing, but I personally have not met him or her.

The question, then, is how will this discrepancy between expectation and reality be resolved? Is it truly “paradoxical”, meaning that it is self-contradictory? Or is it simply a matter of updating our understanding of how genetics works? Coming from the field of genome size evolution, which underwent the same transition decades earlier, I am of the view that “paradox” is not an appropriate descriptor. A complex puzzle — a “G-value enigma” — it may be, but it is one that can be resolved with a broader approach to genetics and much additional research. It took several decades for it to become widely acknowledged that genome size and gene number are unrelated (and indeed, a few authors still argue against it based on a biased dataset consisting exclusively of small, sequenced genomes; see Gregory 2005 for discussion), but we are now developing a reasonable understanding of the non-coding elements of the genome that make up the difference, their effects and (sometimes) functions, and their evolutionary dynamics. Similarly, there are many reasons why gene number and complexity need not be correlated. A list of possibilities is available here (though it was compiled for rather different reasons).

The expectation seems to have been that humans should have comparatively high gene numbers. We do not, and at first this was surprising. Now let us move on to a post-genomic understanding of genetics, and focus less on counting one-dimensional parameters and more on appreciating and ultimately deciphering the complexity inherent within the genome.

_____________

References

Anonymous. 2000. The nature of the number. Nature Genetics 25: 127-128.

Aparicio, S.A.J.R. 2000. How to count…human genes. Nature Genetics 25: 129-130.

Betrán, E. and M. Long. 2002. Expansion of genome coding regions by acquisition of new genes. Genetica115: 65-80.

Claverie, J.-M. 2001. What if there are only 30,000 human genes? Science 291: 1255-1257.

Dunham, I. 2000. The gene guessing game. Yeast 17: 218-224.

Gregory, T.R. 2005. Synergy between sequence and size in large-scale genomics. Nature Reviews Genetics 6: 699-708.

Hahn, M.W. and G.A. Wray. 2002. The g-value paradox. Evolution & Development 4: 73-75.

International Human Genome Sequencing Consortium. 2001. Initial sequencing and analysis of the human genome. Nature 409: 860-921.

International Human Genome Sequencing Consortium. 2004. Finishing the euchromatic sequence of the human genome. Nature 431: 931-945.

Pennisi, E. 2000. And the gene number is …? Science 288: 1146-1147.

Pennisi, E. 2003. A low gene number wins the GeneSweep pool. Science 300: 1484.

Pennisi, E. 2007. Working the (gene count) numbers: finally, a firm answer? Science 316: 1113.

Pennisi, E. 2007. Why do humans have so few genes? Science 309: 80.

Semple, C.A.M., K.L. Evans, and D.J. Porteous. 2001. Twin peaks: the draft human genome sequence. Genome Biology 2: comment2003.2001-comment2003.2005.

Venter, J.C., et al. 2001. The sequence of the human genome. Science 291: 1304-1351.

Watson, J.D. 2001. The human genome revealed. Genome Research 11: 1803-1804.

Non-coding DNA and the opossum genome.

The genome sequence of the gray short-tailed opossum, Monodelphis domestica, was published in today’s issue of Nature (Mikkelsen et al. 2007). It is interesting for many reasons, including its status as the first marsupial genome to be sequenced, its relatively large genome size, and low chromosome number (2n = 18). It is also interesting because it contains a similar number of genes (18,000 – 20,000) to humans, the vast majority of which exhibit close associations with the genes of placental mammals. Also, in keeping with the hypothesis that transposable elements are the dominant type of DNA in most eukaryotic genomes, the comparatively large opossum genome is comprised of 52% transposable elements, the most for any amniote sequenced so far.

One of the most intriguing discoveries about the opossum genome is that changes to protein-coding genes seem not to have been the driving force behind mammalian diversification. Instead, non-coding elements with regulatory functions — mostly derived from formerly parasitic transposable elements — appear to underly much of the difference.

Now, I would prefer to just talk about the science here, noting that this is yet another great example of the complex nature of genome evolution, the key role played by “non-standard” genetic processes (Gregory 2005), and the ever-increasing relevance of non-coding DNA in genomics. But, inevitably, I must comment on how this discovery has been reported. Here is what ScienceDaily (which I otherwise like a great deal) said about it:

Opossum Genome Shows ‘Junk’ DNA Source Of Genetic Innovation

(…)

The research, released Wednesday (May 9) also illustrated a mechanism for those regulatory changes. It showed that an important source of genetic innovation comes from bits of DNA, called transposons, that make up roughly half of our genome and that were previously thought to be genetic “junk.”

The research shows that this so-called junk DNA is anything but, and that it instead can help drive evolution by moving between chromosomes, turning genes on and off in new ways.

(…)

It had been initially thought that most of a creature’s DNA was made up of protein-coding genes and that a relatively small part of the DNA was made up of regulatory portions that tell the rest when to turn on and off.

As studies of mammalian genomes advanced, however, it became apparent that that view was incorrect. The regulatory part of the genome was two to three times larger than the portion that actually held the instructions for individual proteins.

I will just reiterate two brief points, as I have already dealt with some of these topics in earlier posts (and will undoubtedly have to do so again in the future). One, very few people have actually argued that all non-coding DNA is 100% functionlesss “junk”, and no one is surprised anymore when a regulatory or other function is observed for some non-coding DNA sequences. Moreover, transposable elements are more commonly labeled as “selfish DNA”, and it has been noted in countless articles that they can and do take on functions at the organism level even if they begin as parasites at the genome level. Two, yet again we are talking about a small portion of the genome such that this should not be considered a demonstration that all non-coding DNA is functional. In particular, the authors identified about 104 million base pairs of DNA that is conserved (i.e., shared and mostly invariant) among mammals, about 29% of which overlapped with protein-coding genes. In other words, about 74 million base pairs of non-coding DNA, much of it derived from former transposable elements, is found to be conserved among mammals and shows signs of being functional in regulation. The genome size of the opossum is probably around 3,500 million bases, which means that this functional non-coding DNA makes up 2% of the genome.

A note to science writers. There is nothing surprising about some sequences of non-coding DNA having an important function. The notion that all non-coding DNA has long been assumed to be completely functionless junk is a straw man. And to avoid misleading readers, you really need to specify that most examples of non-coding DNA with a function represent a very small portion of the total genome.

___________

References

Gregory, T.R. 2005. Macroevolution and the genome. In The Evolution of the Genome (ed. T.R. Gregory), pp. 679-729. Elsevier, San Diego.

Mikkelsen, T.S., M.J. Wakefield, B. Aken, C.T. Amemiya, J.L. Chang, S. Duke, M. Garber, A.J. Gentles, L. Goodstadt, A. Heger, J. Jurka, M. Kamal, E. Mauceli, S.M.J. Searle, T. Sharpe, M.L. Baker, M.A. Batzer, P.V. Benos, K. Belov, M. Clamp, A. Cook, J. Cuff, R. Das, L. Davidow, J.E. Deakin, M.J. Fazzari, J.L. Glass, M. Grabherr, J.M. Greally, W. Gu, T.A. Hore, G.A. Huttley, M. Kleber, R.L. Jirtle, E. Koina, J.T. Lee, S. Mahony, M.A. Marra, R.D. Miller, R.D. Nicholls, M. Oda, A.T. Papenfuss, Z.E. Parra, D.D. Pollock, D.A. Ray, J.E. Schein, T.P. Speed, K. Thompson, J.L. VandeBerg, C.M. Wade, J.A. Walker, P.D. Waters, C. Webber, J.R. Weidman, X. Xie, M.C. Zody, J.A.M. Graves, C.P. Ponting, M. Breen, P.B. Samollow, E.S. Lander, and K. Lindblad-Toh. 2007. Genome of the marsupial Monodelphis domestica reveals innovation in non-coding sequences. Nature 447: 167-177.


Gene number and complexity.

Leaving aside the difficulty in defining terms such as “complexity” and “gene“, there has been for many decades an underlying assumption that there ought to be some relationship between morphological complexity and the number of protein-coding genes within a genome. This is a holdover from the pre-molecular era of genetics, when it was at first thought that total genome size should be related to gene number, and thus to complexity. Indeed, the constancy of DNA content within chromosome sets (“C-values”) was taken as evidence that DNA is the substance of heredity, and yet it was recognized as early as 1951 that there is no clear relationship between the amount of DNA per genome and organismal complexity (e.g., Mirsky and Ris 1951; Gregory 2005). By 1971, this had become known as the “C-value paradox” because it seemed so self-contradictory (Thomas 1971). (The solution to the C-value paradox was that most eukaryotic DNA is non-coding, although this raises plenty of questions of its own).

Nevertheless, one sometimes encounters arguments that there is a positive correlation between complexity and genome size, even in the scientific literature. Let me put to rest the notion that genome size is related to complexity on the broad scale of eukaryotic diversity. Here is a figure from Gregory (2005) showing the known ranges and means for more than 10,000 species of animals, plants, fungi, protists, bacteria, and archaea (click image for larger view).


The notion that gene number and complexity should be related has survived largely intact into the post-genomic era, in no small part due to the popular tendency to describe genomes as “blueprints”. Genomes are not blueprints because there is no direct correspondence between a given bit of the genome and a particular piece of the organism. If one must have an analogy for how genomes operate, then a far more appropriate one is with recipes and cakes. No single word in a recipe specifies a particular crumb of a cake, but following the recipe correctly will result in a cake nonetheless. It probably does not need spelling out, but genomes are the recipe, development is the process of mixing ingredients and baking, and organisms are the cake.


Now, one might expect that a more complex cake would require a more verbose recipe, and indeed on a very general level this is true: viruses have very few genes, bacteria and archaea have more, and eukaryotes have more still. Beyond that, however, it is not necessarily the case that a complex cake needs a recipe with more individual instructions. If the language is very efficient — for example, if one sentence in the recipe can convey several steps, or if one can combine the same basic instructions in different ways to make different parts of the cake — then a short recipe might easily produce a more complex cake than one that goes on for several pages.

While predictions regarding human gene number varied considerably prior to the completion of the human genome sequence in 2001, it was nevertheless somewhat surprising that the gene count is only about 20,000-25,000 for a human (International Human Genome Sequencing Consortium 2004). In fact, some people started calling this the “G-value paradox” or “N-value paradox” (for Gene or Number) in reference to the older C-value paradox (Claverie 2001; Betrán and Long 2002; Hahn and Wray 2002).

Here is how Comings (1972) described the C-value paradox:

Being a little chauvinistic toward our own species, we like to think that man is surely one of the most complicated species on earth and thus needs just about the maximum number of genes. However, the lowly liverwort has 18 times as much DNA as we, and the slimy, dull salamander known as Amphiuma has 26 times our complement of DNA. To further add to the insult, the unicellular Euglena has almost as much DNA as man.

And here are Harrison et al. (2002) (probably mostly facetiously):

The sequencing of the genomes of six eukaryotes has provided us with a related quandary: namely, how is the number of genes related to the biological complexity of an organism (termed an ‘N-value’ paradox by Claverie [2001])? How can our own supremely sophisticated species be governed by just 50-100% more genes than the nematode worm?

Of course, neither the “C-value paradox” nor the “G-value paradox” is a paradox at all. As I have said elsewhere, this simply follows the common but erroneous equation of simplistic expectation + contradictory data = “paradox”. Some genes may encode multiple proteins and gene regulation may be more important than gene number, which means that constructing a complex organism does not require a large number of genes any more than it requires a large genome. No paradoxes.

But why might less complex organisms possess large numbers of genes? Rice (Oryza sativa), for example, is thought to have about 50,000 genes, or twice as many as humans (Goff et al. 2002; Yu et al. 2002). One possible explanation is that rice is an ancient polyploid whose entire genome was duplicated in its ancestry. (At least one round of genome duplication also happened early in the evolution of vertebrates, though most lineages now behave genetically as diploids).

But what about something like a purple sea urchin (Strongylocentrotus purpuratus), whose genome apparently encodes 23,300 genes? As deuterostomes, sea urchins are more closely related to vertebrates than to other invertebrates, but that alone does not explain the fact that they have a gene number roughly equivalent to humans (at least, not under the simplified view of genome evolution being discussed). Further, relatedness to self-described complex organisms certainly can’t explain why corals, which are very distant relatives of vertebrates and considered to be relatively “simple” animals, also have somewhere around 20,000 to 25,000 genes.


It turns out that genes involved in immunity are extraordinarily abundant in sea urchins and corals, and that this could account for a significant portion of their total gene number. (Sensory and developmental genes also appear to be very well represented in the sea urchin genome). It is well known that pathogen populations can evolve rapidly and thus that a single host defense mechanism may not remain effective for long. Vertebrates handle the infectious onslaught with a two-tiered system. First, “innate immunity“, which is based on non-specific immune reactions to pathogen attack and is the first response of the body’s immune system. This sort of immunity involves a suite of genes that generate a generalized but limited immune response. In this case there is something of a link with complexity, namely that in order to have a more complex set of possible responses, one would need to have more such genes. All animals possess innate immunity, but only the jawed vertebrates also exhibit “adaptive immunity“, which provides a tailored response to individual pathogens. This system does not involve an individual gene for every possible pathogen, but rather employs an array of duplicated genes that can be shuffled in an effectively limitless number of combinations, like railway cars on a long train, to produce a wide variety combinations of antibodies.

The net result is that vertebrate immunity is more flexible, but that this is achieved not through the addition of tens of thousands of new genes, but through the evolution of a system that can recombine existing genes. Groups like echinoderms and cnidarians, by contrast, may require more immune genes to accomplish an effective level of defense because they lack this ability to use existing genes in a large number of combinations. While analogies between human inventions and biological systems can be very problematic, it does seem apt to point out that more sophisticated technologies are frequently simpler, smaller, and more efficient, with fewer parts. A large number of components and a high degree of physical complexity can represent the primitive rather than the derived state in both engineering and evolution.

More DNA generally, or more genes in particular, need not relate to morphological complexity. The more knowledge has accumulated about the size, content, and regulation of genomes, the more the basis for expecting such an association has eroded. Being shocked by, or even ashamed of, the fact that humans do not reign supreme in terms of genome size or number of genes is not the appropriate reaction. Rather, realizations such as these should be exciting and should stimulate the next generation of genomic investigation.

_________

References

Betrán, E., and M. Long. 2002. Expansion of genome coding regions by acquisition of new genes. Genetica 115: 65–80.

Claverie, J.-M. 2001. What if there are only 30,000 human genes? Science 291: 1255–1257.

Comings, D.E. 1972. The structure and function of chromatin. Advances in Human Genetics 3: 237-431.

Goff, S.A. et al. 2002. A draft sequence of the rice genome (Oryza sativa L. ssp. japonica). Science 296: 92-100.

Gregory, T.R. 2005. Synergy between sequence and size in large-scale genomics. Nature Reviews Genetics 6: 699-708.

Gregory, T.R. 2006. Genomic puzzles old and new. ActionBioScience.org.

Hahn, M.W. and G.A. Wray. 2002. The g-value paradox. Evolution & Development 4: 73-75.

Harrison, P.M., A. Kumar, N. Lang, M. Snyder, and M. Gerstein. 2002. A question of size: the eukaryotic proteome and the problems in defining it. Nucleic Acids Research 30: 1083-1090.

International Human Genome Sequencing Consortium. 2004. Finishing the euchromatic sequence of the human genome. Nature 431: 931–945.

Mirsky, A.E. and H. Ris. 1951. The desoxyribonucleic acid content of animal cells and its evolutionary significance. Journal of General Physiology 34: 451-462.

Pennisi, E. 2006. Sea urchin genome confirms kinship to humans and other vertebrates. Science 314: 908-909.

Rast. J.P., L.C. Smith, M. Loza-Coll, T. Hibino, and G.W. Litman. 2006. Genomic insights into the immune system of the sea urchin. Science 314: 952-956.

Sea Urchin Genome Sequencing Consortium. 2006. The genome of the sea urchin Strongylocentrotus purpuratus. Science 314: 941-952.

Thomas, C.A. 1971. The genetic organization of chromosomes. Annual Review of Genetics 5: 237-256.

Yu et al. 2002. A draft sequence of the rice genome (Oryza sativa L. ssp. indica). Science 296: 92-100.

Genome size is good for you.

I imagine that every practicing scientist has experienced, in one form or another, the tendency of many non-scientists to expect all research to be directly beneficial to human health and well-being. I used to respond facetiously to these kinds of expectations when expressed by friends or family members, with something along the lines of “My work has absolutely no practical applications to human welfare whatsoever”.

Of course, this is not true. Genome size is becoming very relevant to fields of inquiry that are likely to have major significance for medicine. Notably, genome size data provide an important indication of the cost and difficulty of sequencing a given genome, and thus represent a prime criterion in the choice of sequencing targets. As an example, I performed a genome size estimate for Biomphalaria glabrata, a planorbid snail that serves as an intermediate host for the trematode flatworm Schistosoma mansoni which causes the debilitating disease known as schistosomiasis. The genome of B. glabrata is one of the smallest so far reported for a gastropod, and is now being sequenced (along with S. mansoni).

More recently, Jenner and Wills (2007) made explicit mention of genome size as an important factor in deciding on the next set of models for evo-devo studies. Discoveries regarding the fundamental genetic underpinnings of development have obvious implications for medical science and here, too, genome size is becoming increasingly seen as important. As they put it,

Whole-genome sequences are an increasingly important resource for many biological disciplines, including evo–devo15, 49, 50. However, financial and technical constraints mean that there is currently a preference for species with small genomes. This compounds the bias that is already introduced by the big six. First, putatively general conclusions about genome evolution might actually be specific to those smaller genomes that have been fully sequenced. For example, when focusing only on sequenced genomes, a close correspondence between genome size and gene number in eukaryotes is observed. The C-value paradox becomes apparent only when genome-size data from non-sequenced genomes is included51. Second, there are important genetic, morphological, physiological and ecological correlates of genome size in a range of animals and plants51, 52. Some correlates seem ubiquitous in animals and plants, such as those between genome size and cell size, body size and the inverse of developmental rate52. Others are group specific: genome size correlates mostly with metabolic rate in homeotherms, but with developmental type and ecology in amphibians53, and is positively correlated with egg size in copepods, plethodontid salamanders and fishes51, 52, 54. Studying these correlated traits in phylogenetically disparate taxa could illuminate the relationships between small genome size and rapid development, as well as the evolution of strongly cell-lineage-dependent development in taxa such as tunicates and nematodes, and the partial fragmentation of their Hox clusters55, 56.

References 51, 52, and 53 in that paragraph are papers of mine, so again I am forced to admit that my work may have some practical application after all.

My main focus is on genome size diversity in eukaryotes, which mostly means differences among species in the abundance of noncoding DNA. In bacteria, most of the genome is composed of protein-coding genes, so unlike in eukaryotes there is a very strong correlation between genome size and gene number. Genome size is generally small in parasites and endosymbionts and larger in free-living species (probably because population bottlenecks and relaxed selection on gene function result in gene loss by deletion bias in bacteria associated with hosts [Mira et al. 2001]).

But this observation is not the link between genome size and human health that I had in mind for this post. In this month’s issue of Antimicrobial Agents and Chemotherapy, Steven Projan argues that genome size is associated with the evolution of antibiotic resistance in bacteria. In Dr. Projan’s own words,

It is observed here that the ability of a given bacterium to evolve toward a multidrug resistance phenotype is a function of genome size. In Table 1, a number of examples are provided, but even an expanded analysis shows that this observation holds true. That is, the larger the genome the greater the propensity of a bacterium to display multidrug resistance phenotypes and the smaller the genome the less likely it is that antibacterial resistance will emerge and disseminate within that species. What is proposed here is that, just as there is a continuum of genome sizes among bacteria, there is a continuum in the ability or propensity of a bacterium to become “multidrug resistant” and that continuum is reflected in the size of the genome. This is not to say that we do not observe resistance to certain agents even in organisms with the smallest genomes (macrolide resistance appears in virtually every pathogen at some level). There is probably a solid biological reason for this observation; organisms with larger genomes are more adaptable to environmental changes because they have more (genetic) information to draw upon. It appears that organisms with smaller genomes have become more “specialized,” residing in particular environmental niches (Treponema pallidum and the Chlamydiae are cases in point), and their lack of versatility in adapting to different environments is also manifest in an inability to develop mechanisms for coping with antibiotics. Indeed, we have learned that virtually each and every time a bacterium either acquires a novel resistance determinant or a mutant strain arises with decreased susceptibility to an antibacterial drug, the bacterium experiences a “fitness burden.” With time, compensatory mutations are selected in which the bacterium accumulates mutations that allow for something like wild-type growth in a strain that is now phenotypically resistant (e.g., topA mutations in gyrB mutant strains). Bacteria with larger genomes simply have a greater opportunity to develop these compensatory mutations. It must be emphasized that it does not matter whether we are discussing the acquisition of a novel resistance gene as opposed to a mutation that alters the target or results in up-regulation of an efflux pump. The accumulating evidence tells us that all require some form of adaptation. Another consequence of this phenomenon is that antibiotic cycling in health care settings is unlikely to result in a reversion of the local microflora to susceptibility as the compensatory mutations “lock in” the resistance phenotype.

He continues by noting, “I and several of those I have discussed this observation with were perplexed that it had not previously been articulated. Although to be fair, others have suggested it is a trivial, if not nonsensical, observation and worthy only of cocktail party conversation… in fact, I believe that this is an important guide as to where and which organisms we actually need novel antibacterial agents for.” Projan blames an overemphasis on individual organisms with small genomes for the overlooking of this potentially important pattern. In other words, it is the sort of thing that can only be applied to human health research if one takes a broad view of genomic diversity.

As much fun as it is to study genome size for purely academic reasons, it seems it actually may be good for us too.


Genomics, evolution, and health: comparisons of avian flu genomes.

An article by Steven Sternberg and colleagues is set to appear in the May issue of the journal Emerging Infectious Diseases. In it, the authors describe the results of complete genome sequence comparisons for 36 recent isolates of the avian flu virus (influenza H5N1). Their results “clearly depict the lineages now infecting wild and domestic birds in Europe and Africa and show the relationships among these isolates and other strains affecting both birds and humans”. More specifically,

The isolates fall into 3 distinct lineages, 1 of which contains all known non-Asian isolates. This new Euro-African lineage, which was the cause of several recent (2006) fatal human infections in Egypt and Iraq, has been introduced at least 3 times into the European-African region and has split into 3 distinct, independently evolving sublineages.


Figure 1. Phylogenetic tree of hemagglutinin (HA) segments from 36 avian influenza samples. A 2001 strain (A/duck/Anyang/AVL-1/2001) is used as an outgroup at top. Clade V1 comprises the 5 Vietnamese isolates at the bottom of the tree, and clade V2 comprises the 9 Vietnamese isolates near the top of the tree. The European-Middle Eastern-African (EMA) clade contains the remaining 22 isolates sequenced in this study; the 3 subclades are indicated by red, blue, and purple lines. The reassortant strain, A/chicken/Nigeria/1047–62/2006, is highlighted in red.

This is a study in phylogenetics — that is, it reconstructs evolutionary relationships among viral strains using the same tools that many evolutionary biologists use to study the relationships among species. It is well known that viruses evolve very rapidly, and tracking their their past changes contributes to the ability to predict future ones. As the authors conclude,

These findings show how whole-genome analysis of influenza (H5N1) viruses is instrumental to the better understanding of the evolution and epidemiology of this infection, which is now present in the 3 continents that contain most of the world’s population. This and related analyses, facilitated by global initiatives on sharing influenza data, will help us understand the dynamics of infection between wild and domesticated bird populations, which in turn should promote the development of control and prevention strategies.

Evolution is not something that only happened to the myriad fossil specimens housed in museum drawers, and evolutionary biology is not merely relevant to academics tucked away in research labs. Evolution is both an ongoing process and an active and exciting area of research. More than ever, an understanding of the processes involved is relevant to the well-being of people from all regions of the world.