The nature of science: required reading.

Many researchers have been strongly influenced by Karl Popper’s idea of falsificationism. In fact, one often hears that falsificationism is a (if not the) defining feature of the scientific method. Is it? For those who are open to a different understanding of scientific methods (plural), I recommend the following:

Birkhead, T. 2008. In praise of fishing trips. Times Higher Education, July 31st.

Cleland, C.E. 2001. Historical science, experimental science, and the scientific method. Geology 29: 987-990.

Cleland, C.E. 2002. Historical science, experimental science, and the scientific method: reply to Kilty. Geology 30: 951-952.

Cleland, C.E. 2002. Methodological and epistemic differences between historical science and experimental science. Philosophy of Science 69: 474-496.

Glass, D.J. and N. Hall. 2008. A brief history of the hypothesis. Cell 134: 378-381.

Hansson, S.O. 2006. Falsificationism falsified. Foundations of Science 11: 275-286.

Hull, D.L. 1999. The use and abuse of Sir Karl Popper. Biology and Philosophy 14: 481-504.

Understanding Science

Do crabs feel pain?

I posted some time ago about a study suggesting that crustaceans may feel “pain”. It is obviously very difficult to assess what this means outside of humans, but there is a new follow-up study being discussed in the science news that adds a little more insight. Here are some links:

Crabs Not Only Suffer Pain, But Retain Memory Of It

Crabs’ memory of pain confirmed by Queen’s academic

Boiling Mad: Crabs Feel Pain

The actual paper.

Mercer and 22 Minutes.

I have not been able to find clips on Youtube to post, but this week both the Rick Mercer Report and This Hour Has 22 Minutes had bits regarding Canada’s science minister.

You can at least watch the 22 Minutes clip here (under “Rex Murphy” for Mar. 24, 2009).

If anyone finds the Mercer and 22 Minutes clips around, post in the comments.

Reflecting on my first experience with research.

I often tell undergraduates about the importance of conducting research projects in their senior year if they intend to pursue graduate studies in science. There are two main reasons for this. The first is that the labs that they have experienced up to that point in undergraduate courses, though useful for introducing specific concepts, are a poor reflection of what real science is like. As such, it is important for them to experience original lab work, rather than simply following a pre-defined, “cook book” protocol with an expected result. Novel studies have no pre-defined sequence, no a priori expectation of the outcome, and in many cases no established methods in place for generating data. The second is that there are some important lessons that they need to learn about research, perhaps most importantly that whatever they try to do in the lab will not work the first time. The sooner they hit that wall — and get around it — the better. Nature does not give up her secrets easily, I sometimes say.

My first experience with original research came during my fourth year at McMaster University (Hamilton, Canada), though the story actually begins the year before. In the late 1990s, McMaster offered a course on “environmental physiology” which explored the various ways that animals had become adapted to different extreme environments and lifestyles. For example, how insects can survive in deserts or how deep diving mammals conserve oxygen. I was very interested in organism biology and wanted to take this course, but it was a senior course and was only offered in alternate years. This meant taking it in my 3rd year without the prerequisites, which the instructors agreed to let me (and my roommate) do, as long as we took the prerequisities after the fact.

There were fewer than 10 people in the class (several of whom were graduate students) as it had a reputation for being very intense, with long labs on Friday evenings. Because of the small class size, we came to know the professors rather well, and I naturally asked them to supervise my undergraduate thesis project the following year. Specifically, I worked with Dr. Chris Wood, who is a very well regarded fish physiologist. Most of the work in his lab at the time had to so with metal toxicity, waste excretion, and so on, but one area struck me as particularly interesting — it turned out that an earlier study had suggested that fish who grew the most rapidly did not swim well. Being interested in evolution and organism biology, the notion of a trade-off between growth and swimming seemed like a very interesting issue to explore. I proposed a project that would look at this possible trade-off between growth and swimming, but also would include a component of feeding competition and social hierarchy (Who gets the most food? Who grows fastest? Do dominant fish swim worse than subordinate fish?).

There were, of course, numerous obstacles to overcome. How could I identify individual fish? How could I measure dominance rank and feeding? How should swimming performance be assessed? What size of fish should be used? And so on. After much trial and error, I settled on a system for identifying fish using a coded system of ink dots on the skin which were made using an injector that was once used to inject anaesthetic into the gums of dental patients. Lesson 1: Be prepared to be creative in terms of what counts as a scientific apparatus. (Dr. Wood once published a study conducted in Kenya which described the fish as being kept in “amber Tusker chambers” — Tusker being the local beer).

Figure from my undergraduate thesis indicating the identification
method I developed. Pretty decent for Windows Paint, if I may say so myself.

Growth rate was relatively straightforward in principle: weigh and measure the lengths of the fish at regular intervals. Fortunately, someone else in the lab had constructed a “fish measuring tube”, which was a transparent plastic half-cylinder with a ruler under it, on a slant with drain holes at the bottom. Worked a treat.

Some dude weighing a fish.

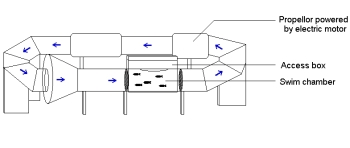
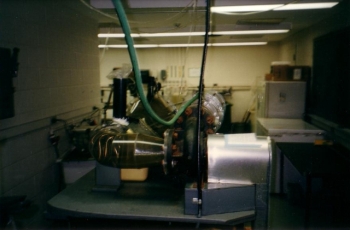
Swimming performance was assessed using a huge swim tunnel that had been built years before, but which was modified so I could reach in and get the fish to keep swimming once they had become stuck against the grating at the end of the swim section. I measured both maximum sustainable velocity (called Ucrit) as well as burst swimming.

 Diagram from my thesis showing the swim tunnel apparatus.

The actual swim tunnel, which we knew as “Big Bertha”.

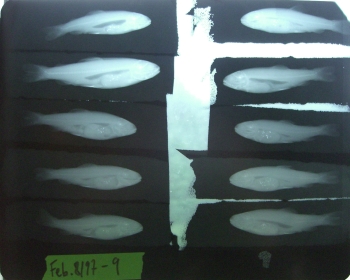
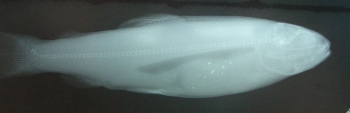
The quantification of feeding rates of individual fish (and by extension, their dominance rank) probably represented the most unusual component of the study. These were assessed by feeding the fish opaque glass beads mixed into the food and x-raying them so the beads in their stomachs could be counted. McMaster’s biology department is adjacent to a hospital, so I was able to secure the use of a small, portable x-ray machine that I could cart over to the lab on weekends. To make bead-laden food, I ground up fish pellets and mixed them with beads in a spaghetti maker, extruded the mush into strands and cut them into small pieces. I had to prepare all the food this way as a control, but I only gave them food with beads on days when they were to be x-rayed. To develop the x-ray images, I would go into the dark room in the radiology depatment of the hospital. This involved feeding the exposed films through an automatic developing machine which dropped the developed images into a slot outside the dark room. More than once I came out to find radiologists glancing curiously at my pictures of fish.

A typical x-ray film showing the difference in feeding among individual fish.

Close up of one fish showing the beads (white spots) in its stomach.

My first attempt at the study did not go well. The fish I had chosen were too small, and some even escaped from the swim chamber. I had chosen too high a ration to feed the fish, and the competition among individuals was negligible. I even had a flood in one tank and came in to find several fish flopping around on the floor before I returned them to their tank. Lesson 2: Be prepared for even the most carefully planned experiment to be a bust at first. As a matter of fact, I decided to start again after the holidays with larger fish and different rations. Given the short time involved (two semesters, one of which had then passed), it took some convincing for Dr. Wood to let me start from scratch. However, I knew I would not be confident in the data from the first run and I was fairly certain I had worked out the bugs the first time through.

In the end, we discovered that the fish who eat the most and grow the fastest do indeed show poorer sustained swimming performance, but only in the case where the ration is limited. Faster growing fish have better burst swimming abilities, by contrast. This supports the idea that there may be trade-offs between rapid growth and some types of swimming ability, at least when food is limited, meaning that there may be limits on the benefits of growing more quickly than other individuals.

I worked in the Wood Lab during the summer after this study and did two follow-up experiments. We also polished up my thesis and submitted it to a journal — I still remember how excited I was to have my first paper in review. Some major revisions later, the paper was accepted for publication. Lesson 3: Be prepared for peer reviewers to pick apart every detail of your work. (Not to worry, as I have since reviewed several fish physiology and feeding behaviour papers in turn).

I finished these studies more than a decade ago, and I now work in a very different area of biology. Nevertheless, the lessons that I learned during my first experience with original research are as significant as ever now that I advise students. If I have done my job well in this role, you may read a similar account from one of my students 10 years hence.

________

Gregory, T.R. and C.M. Wood. 1998. Individual variation and interrelationships between swimming performance, growth rate, and feeding in juvenile rainbow trout (Oncorhynchus mykiss). Canadian Journal of Fisheries and Aquatic Sciences 55: 1583-1590.

Gregory, T.R. and C.M. Wood. 1999. Interactions between individual feeding behaviour, growth, and swimming performance in juvenile rainbow trout (Oncorhynchus mykiss) fed different rations. Canadian Journal of Fisheries and Aquatic Sciences 56: 479-486.

Gregory, T.R. and C.M. Wood. 1999. The effects of chronic plasma cortisol elevation on the feeding behaviour, growth, competitive ability, and swimming performance of juvenile rainbow trout. Physiological and Biochemical Zoology 72: 286-295.

What would I do with more research support? Part Two: "Targeted exploration".

In the first post in this series, I introduced the background topic of my research focus, namely the evolution and impacts of genome size diversity in animals. Before moving on to the specific projects that I would most like to do in the near term if I had the funds, I want to discuss the basic philosophical approach that much of my lab’s work follows.

As I noted recently, there is a strong tendency among many biologists to assume that only “hypothesis-driven” science is valid and informative. I disagree with this position very strongly, as I think it causes people to focus on narrow questions and runs a real risk of making most science little more than an exercise in confirming and refining what we already know. Moreover, it is only feasible to structure one’s research in the simple, falsificationist hypothesis-testing format if there is extensive background knowledge available. When working in a new area where little is known, this is not possible.

Does this mean we should be allowed to just stumble around without really testing any ideas? Of course it doesn’t. The alternative is to step back from individual hypotheses and to carry out what I call “targeted exploration”. This means that we do not feel it necessary to formulate our research in the simplistic “Ho, H1” format with a “yes/no” result structure. Instead, we take what information is available and try to identify patterns. If no information is available at all for some area, then we might explore it with the specific purpose of looking for patterns. Once a possible pattern is identified, we determine ways of testing how broadly it holds and what might be causing it. This involves more exploration, but specifically in areas that are intended to provide the necessary data to test the broad pattern. If the pattern holds, then we can formulate even more specific ideas about causation, leading eventually to the testing of particular hypotheses.

Some important points should be noted. First, targeted exploration does not conflict with focused hypothesis testing. Rather, it ultimately feeds into hypothesis-driven research, but is particularly important because it takes us into new territory rather than working within existing areas. Second, it is not done blind. There is a specific reason to target particular areas. Third, as it does not have a simple refuted/supported result but rather can be set up to reveal many different things, the results can be very informative either way. Finally, because it is based on large-scale sampling, exploration of this type has the beneficial side effect of closing some major gaps in our basic knowledge.

Let me give you an example of how this works.

Insects are by far the most diverse group of animals, at least in terms of described species. However, they have traditionally been poorly covered in animal genome size studies. When I was a graduate student, I compiled the Animal Genome Size Database, which made it possible to look across all the data that were available and see what patterns emerged. Based on work in amphibians, it was apparent that species with complex developmental programs including metamorphosis had smaller genomes than species without metamorphosis. I wondered if something similar might apply to insects, given that there are orders with complete metamorphosis (holometabolous development) and orders with incomplete metamorphosis (hemimetabolous development).

That is step 1: ask a question and look for a pattern. The data for insects were very limited, but it did seem as though insects with complete metamorphosis possess smaller genomes than those lacking complete metamorphosis, making this similar to the case in amphibians. However, there were not really enough data to say much about this, so as part of my graduate work I set out to get more insect data. I added a few hundred species, mostly just whatever I could get locally, and doing my best to include species from several orders with and without metamorphosis. That is step 2: assemble a dataset that can at least be used to identify a possible pattern. At this stage, the sampling is somewhat unconstrained — just get whatever you can, with the question still in mind. Why do it like this? Because a) you don’t have enough information to be very specific in what data you need, b) you’re working in a new area, so any data you get will be informative, and c) you don’t know if the pattern you are looking for is really the main pattern, so it is best to sample more widely in case some other pattern shows up.

Here is what I found:

With the exception of one beetle species out of more than 150 (and I still want to check this myself), no insects with complete metamorphosis appear to have genome sizes larger than 2pg (~ 2 billion base pairs). On the other hand, orders without complete metamorphosis often include species with enormous genomes.

So, step 3 is then to see whether this holds with a broader sampling. Now we are getting into the targeted exploration. What we need is a) more data from holometabolous orders (do they exceed this threshold and we just haven’t found them?) and b) more from hemimetabolous orders (do most of them have examples that are larger than the threshold?). Since this possible pattern was identified, we have added hundreds of species from both kinds of insects, including about 400 butterflies and moths (holometabolous, none larger than 2pg), 90 wasps, ants, and bees (holometabolous, none larger than 2pg), 75 flies (holometabolous, none larger than 2pg), and 100 dragonflies (about 1/5 of known diversity in North America; hemimetabolous, a few larger than 2pg). So far, so good, and this work continues with current projects on wasps, flies, caddisflies, and stone flies. But questions remain: Does this hold in additional orders? Is there really a link between development and genome size in insects? Why 2pg? Are there other explanations (e.g., other constraints, phylogenetic effects, differences at the level of mutational mechanisms)?

For step 4, we started to test this idea that development constrains genome size in insects. First, we looked at the rate of development (egg to adult) within a single genus (Drosophila), and found a significant correlation with genome size. We have also started looking at “curious” orders that may be exceptions that prove the rule: for example, mayflies have an additional nymphal moult that other hemimetabolous orders don’t, so this may impose an additional constraint and keep their genomes small — I have only looked at one so far (yes, small), but I will let you know how it turns out once we do a large sample. We are also looking at specific comparisons within orders based on a combination of their traits (developmental rate, parasitic vs free living, body size, flight) and phylogenetic relationships. In this case, shifts in lifestyle are especially informative because they may illustrate an evolutionary association between genome size and the characteristics of interest.

Assuming these patterns hold up and we are convinced that development is linked with genome size, we will want to know how — thus, step 5. The most likely mechanistic bridge between genome size and organism development is cell division. However, no one has looked at cell division rate across insects with different genome sizes. This would be much more difficult than doing large-scale surveys, but it could be focused on a few representative species with different DNA amounts. If we really want to know if DNA content affects cell division, we would need to examine this experimentally in step 6 — for example, by actively adding or removing different amounts of DNA and observing the effects on cell cycle parameters. I have been trying for a few years to get funding to do this (in yeast initially), but no success.

I think it is obvious that this kind of approach falls outside the typical hypothesis-driven focus. However, it does get us from knowing almost nothing in step 1 to formulating and testing specific hypotheses in step 6. Along the way, we have greatly expanded the available dataset, and have revealed several additional patterns worh exploring within some orders. If I had to express each step in the form of hypotheses, I probably could, but because we are exploring so many questions at once in each step, it makes more sense to just think about questions and make sure the sampling will allow us to generate answers. Without the existing knowledge base, focusing on one hypothesis only is premature and very limiting in what it will accomplish.

Obviously, we are not just interested in insects. Over the rest of the series, I will talk about other groups that we are eager to explore, and will discuss in more detail some of the focused work on mechanisms that I am interested in. Some of these therefore begin at step 1, others at step 6, and some somewhere in between.