Dog’s Ass Plots (DAPs).

The word logodaedaly means “a capricious coinage of words”. It was coined by Plato in the 4th century BC (as “wordsmith”) and picked up by Ben Johnson in 1611 in its current English usage. That’s right, someone coined a term for the process of coining terms.

Sometimes new terms are very useful. Every profession has its own jargon, which for the most part helps experts to save time by having individual terms for specific items or ideas. On the other hand, the original meaning can be lost and the term can be badly misunderstood or misapplied when it moves from jargon to buzzword. “Junk DNA” is a case in point. Other terms may be coined to give a simple summary of a more complex idea. “The Onion Test” is an example: it’s not really about onions, but about providing a reminder that there is more diversity out there than one might otherwise have considered.

Finally, sometimes terms are coined just for fun. This is one of those times.

Several bloggers have drawn attention to the persistent assumption expressed by some authors that humans are the pinnacle of biological complexity, as reflected in certain graphical representations relating to non-coding DNA [Pharyngula, Sandwalk, Sunclipse, Genomicron]. Larry Moran’s discussion pointed to what must be the single worst figure of the genre, from an article in Scientific American. This figure forms the basis of a new term that I wish to coin.

Here is the figure in question:
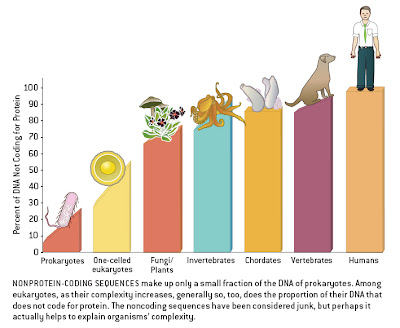


In a previous post, I complained about the ridiculous division of groups (humans are vertebrates and vertebrates are chordates), the lack of labels on the X-axis, the ambiguous definition of “complexity” implied, and the blatant assumption, sans justification, that humans are the most complex organisms around.

I also noted the following issue:

The sloping of the bars within taxa suggests that this is meant to imply a relationship between genome size and complexity within groups as well, with the largest genomes (i.e., the most non-coding DNA) found in the most complex organisms. This would negate the goal of placing humans at the extreme, as our genome is average for a mammal and at the lower end of the vertebrate spectrum (some salamanders have 20x more DNA than humans). Indeed, the human datum would accurately be placed roughly below the dog’s ass in this figure if it included a proper sampling of diversity.

As a result, I hereby propose that all such figures, with unlabeled axes and clear yet unjustified assumptions about complexity, henceforth be dubbed “Dog’s Ass Plots”. “DAPs” or “Dappers” also are acceptable, as in “I’m surprised that the reviewers didn’t pick up on this DAP” or “Check out this figure, it’s a real Dapper”. (As an added bonus, “dapper” means “neat and trim” — which these figures certainly are; the problem is not that they don’t look slick, it’s that they are oversimplified).

I have no doubt that plenty of examples can be found in subjects besides genomics, so please feel free to use it as needed in your own field.


Worst figure of all.

Larry Moran has provided a good discussion of complexity and genome size, and of the confusions that surround their relationship — rather, their lack of a relationship — to one another [Genome size, complexity, and the C-value paradox]. He links to my earlier story about figures that provide a misleading suggestion of a link between complexity and genome size, and in the process he tops the figure I mentioned [What’s wrong with this figure? see also Genome size and gene number]. In fact, the one he notes is easily the worst one I have ever seen like this, for all kinds of reasons. It is from a 2004 article in Scientific American by John Mattick entitled The hidden genetic program of complex organisms.

Where does one begin? For one thing, humans are vertebrates and vertebrates are chordates, so this is just downright ridiculous. “Invertebrates” is paraphyletic as echinoderms are more closely allied to vertebrates than to other non-vertebrate animals. Some fungi are single-celled, and some people consider unicellular algae to be plants. The X-axis in these figures is never labeled, but the obvious implication is that it represents an increasing scale of “complexity”. It is probably unlabeled because otherwise one would have to provide units of complexity, and I doubt that would be straightforward at all. It certainly would be a challenge to justify ranking humans as more complex than dogs — I can not think of any way that one could defend such a position objectively. The sloping of the bars within taxa suggests that this is meant to imply a relationship between genome size and complexity within groups as well, with the largest genomes (i.e., the most non-coding DNA) found in the most complex organisms. This would negate the goal of placing humans at the extreme, as our genome is average for a mammal and at the lower end of the vertebrate spectrum (some salamanders have 20x more DNA than humans). Indeed, the human datum would accurately be placed roughly below the dog’s ass in this figure if it included a proper sampling of diversity.

__________

Updates:

  • An astute, anonymous, commenter has pointed out a further distortion, namely that the disparate heights of the various organisms causes the eye to artificially exaggerate the differences among the bars.
  • This figure has led to the coining of a new term .


Global warming: how do scientists know they’re not wrong?

Back in July, LiveScience ran a piece by Andrea Thompson entitled Global warming: how do scientists know they’re not wrong? Although one could argue that there is too much straining to seem “balanced” (the two deniers quoted receive a vastly disproportionate bit of page space relative to the consensus in science), it is generally a very interesting look at how science deals with politically controversial areas of inquiry, particularly when they involve questions that are not easily amenable to laboratory experimentation or direct observation or which involve extrapolation from available, smaller-scale observations. The parallels with evolution are clear. The lesson: science operates according to a set of principles, and if you reject those principles because some of the conclusions they produce are distasteful to you, you may do so at your own (and everyone else’s) peril.


Mus aureus!

Bertalan Meskó of ScienceRoll, fellow DNA Network member and founder of the Gene Genie carnival, has very graciously awarded Genomicron the “Golden Mouse Award”. As he says,

This is the second time I present the Golden Mouse Award to a blogger. From time to time, I’ll present this award to bloggers who educate people in high quality and write hardcore scientific/medical articles with plenty of references, so to bloggers who make science or medicine more readable for laypeople and for even specialists. Now, the winner is T. Ryan Gregory of Genomicron who proved his enthusiasm and professionalism with posts like these:

What can I say? I’m flattered!

(Yes, I know the golden mouse is Ochrotomys nuttalli and there is no Mus aureus — I was being clever.)


Genome Technology Online is confused.

From Genome Technology Online:

Perhaps They Should’ve Called It “One Man’s Treasure” DNA
September 17, 2007

It seems people are a little touchy about the use of the term “junk DNA.” On his Genomicron blog, TR Gregory attempts to put an end to the debate by harking back to the origins of the term, along with an exegesis of how it has been used over time and in various settings.

While GTO doesn’t doubt the accuracy of Gregory’s information, we have to say: his argument that scientists referred to these genomic regions as “junk” all while understanding how very important they were leaves us a little, well, dubious. But maybe we’re just naturally cynical.

Let me help you out. Comings (1972), who provided the first detailed exposition of the “junk DNA” idea (his article appeared in print before Ohno’s), wrote: “Being junk doesn’t mean it is entirely useless. Common sense suggests that anything that is completely useless would be discarded.” Orgel and Crick (1980), who developed the idea of “selfish DNA”, wrote: “It would be surprising if the host organism did not occasionally find some use for particular selfish DNA sequences, especially if there were many different sequences widely distributed over the chromosomes. One obvious use … would be for control purposes at one level or another. This seems more than plausible.” Both approaches emphasized non-function based on proposed mechanisms of non-coding DNA increase. And both sets of authors noted that some of it would be functional.

Why people seem incapable of a) understanding a mildly complex history, and b) reading the literature is inexplicable to me. Given how much interest there is in non-coding DNA in the press and among anti-evolutionists, I think it is worth getting it straight.


Another good science story.

I have been a bit harsh with science writers on a few occasions, though this has often been in good fun. I actually have a lot of respect for (good) science writers, and I think their job is a very important one — which is why I think it is critical that they do it well. If they were irrelevant, they would garner no attention from scientist-commentators like me.

A few times, I have pointed out stories that I think are very good, and have given credit where it is due. I single out JR Minkel, Aria Pearson, Heather Kowalski, and of course Carl Zimmer as excellent examples.

I will continue to point out both good and bad science writing, and to contribute where I am needed in the form of interviews or commentary. Today I want to link to another good story, this time a press release from the University of Bristol as posted by ScienceDaily.

How The Discovery Of Geologic Time Changed Our View Of The World

This piece does the opposite of my guide to writing a bad science story. It provides some historical context. It shows how knowledge has accrued through the efforts of many researchers. It highlights the difficulty of getting a new idea recognized and how even “revolutionary” propositions do not become accepted overnight. Plus, it’s always useful to know some history of science and to give credit to those giants upon whose shoulders we stand.


Junk DNA: let me say it one more time.

Let me say it one more time.

The term “junk DNA” was not coined on the basis of not knowing what it does. It was not a cop-out or a surrender. Susumu Ohno coined the term in 1972 in reference to a specific mechanism of non-coding DNA formation that he thought accounted for the discrepancies in genome size among species: gene duplication and pseudogenization. That is, a gene is duplicated and one of the copies becomes degraded by mutation to the point of being non-functional with regard to protein coding. (Sometimes the second copy takes on a new function through “neofunctionalization”, or the two copies may split the original function through “subfunctionalization”). “Junk” meant “something that was functional (a gene) but now isn’t (a pseudogene)”.

It has turned out that non-coding DNA is far more complex than just pseudogenes. It also includes transposable elements, introns, and highly repetitive sequences (e.g., microsatellites). For the most part, the mechanisms by which these form are reasonably well understood, and as a result there is good reason to expect that many or even most of them are not functional for the organism. Many authors argue that most non-coding DNA is non-functional, not because of a lack of imagination, but on the basis of a large amount of information regarding its mechanisms of accumulation.

Some non-coding DNA is proving to be functional, to be sure. Gene regulation, structural maintenance of chromosomes, alternative splicing, etc., all involve sequences other than protein-coding exons. But this is still a minority of the non-coding DNA, and there is always the issue of the onion test when considering all non-coding DNA to be functional.

And finally, it needs to be pointed out again that evolutionary biologists and geneticists held a variety of views on functionality, some claiming that it was all functional, some saying very little (but few, if any, saying it was all totally non-functional). Strict adaptationist (“ultra-Darwinian”) thinking had led many authors to assume that non-coding DNA must be doing something useful or it would have been eliminated by selection long ago. The proponents of the “selfish DNA” approach to non-coding DNA wrote their papers in direct response to this overly adaptationist interpretation and argued that much of it could be explained simply by the existence of mechanisms that put it there, independent of organism-level function. But even they expected that some would turn out to play a role in regulation. At the same time, most researchers for the past half century have noted the link between DNA amount and cell size, which means that total non-coding DNA content is not irrelevant biologically. This could, however, be an effect instead of a function, which is why there has for decades been discussion about this issue.

You can tell someone who knows very little about the science or history of “junk DNA” when they make one or more of the following claims: 1) All scientists have always thought it was all totally irrelevant to the organism. 2) New evidence is suggesting that it is all functional. 3) “Darwinism” led to the assumption that non-coding DNA is non-functional. The opposite is true in each case.

One can discuss possible functions for non-coding DNA — that’s not a problem, and it makes for an interesting topic if data are used to back up claims — but please stop distorting the views of scientists both past and present in the process.

___________

See also


Genome size and gene number.

In a previous discussion [What’s wrong with this figure?], I noted that certain things seem to happen with disturbing frequency in discussions of genome size. The first is the invocation of pre-Darwinian “Great Chain of Being” thinking, in which humans are considered the most complex organisms, with all others ranked at lower positions on the scala naturae. Of course, this is not restricted to genomics — one can find references to “lower vertebrates”, “subhuman primates”, or “higher plants” peppered throughout the scientific literature. The second issue is the exclusive use of genome sequence data in discussions of genome size diversity. This is problematic because, with few exceptions, sequencing targets are selected in large part on the basis of having small and manageable genomes. I receive many requests from colleagues to provide genome size estimates, and the hope is always that they will turn out to be small such that they will have a chance of being adopted as a sequencing model. There are obvious pragmatic reasons for this, but it means that one must be careful about interpreting data from an inherently biased set of data.

The previous discussion focused on examples in which authors have tried to demonstrate a link between the amount of non-coding DNA and organismal complexity, by making both of the mistakes outlined above. In this post, I want to discuss the opposite but equally aggravating problem, which is using these same limited data to demonstrate an association between genome size and gene number.

Every now and then, an author makes the claim that gene number and genome size actually are correlated, despite this having been rejected decades ago when the first broad comparisons of genome size were made and the various sorts of non-coding DNA were discovered. The most recent example comes from Lynch (2006):

The same figure appears in Lynch (2007). Click for larger view.

There are two problems that I see with this figure. The first is that it lumps together viruses, bacteria, and eukaryotes. Although Lynch (2006, 2007) argues that there is a smooth continuum between the parameters across these taxonomic boundaries, and thus that there is no difficulty when combining these data, I would suggest that the very different genomic properties of these groups should be cause for questioning this approach. For example, it is well known that gene number and genome size are strongly correlated among “prokaryotes”, because they generally exhibit a paucity of non-coding DNA. This means that including them anchors the correlation at the bottom end.

Genome size is strongly related to gene number in both archaea and bacteria. Figure from Gregory and DeSalle (2005). Click for larger view.

The second problem is, obviously, that this is based on a selective set of species. An estimate of gene number is best achieved with a genome sequence, but genome sequences typically are available only for small genomes. If one assumes that most species in a given group (say, a phylum) have roughly similar gene numbers and plots the actual diversity of genome size (e.g., mean for that phylum), the relationship is nowhere near as clear. Indeed, it drops off completely.

From Gregory (2005). Click for larger view.

In fact, you can see this happening already in Lynch’s (2006, 2007) figure. Note that there is a totally flat line for the animal data, even though these come from species with comparatively modest genome sizes. Since I work on animals (whose genome sizes range 3,300-fold), I would say that there is no relationship between genome size and gene number in my group. If you compare animals to bacteria, then there is such a relationship, of course, but that almost goes without saying, and could relate to differences in chromosome structure as much as anything else.

The point is that genome sequencing data are extremely useful, including in discussions of genome size, but that they, like all data, must be interpreted within their proper context. Genome sequencing models, at least at the moment, do not encompass the diversity that exists among eukaryotes. In fact, even with 10,000 species in the various databases [animals, plants, fungi], the current dataset of eukaryotic genome size diversity itself is far from comprehensive.

The diversity of archaeal, bacterial, and eukaryotic genome sizes as currently known from more than 10,000 estimates. From Gregory (2005). Click for larger view.

What is clear, and has been for decades, is that genome size evolves independently of organismal complexity and gene number (which themselves may evolve more or less independently of one another). This makes it a very intriguing puzzle to study, one that has resisted all attempts at one-dimensional explanation for over half a century.

___________

References

Gregory, T.R. 2005. Synergy between sequence and size in large-scale genomics. Nature Reviews Genetics 6: 699-708.

Gregory, T.R. and DeSalle, R. 2005. Comparative genomics in prokaryotes. In: The Evolution of the Genome, edited by T.R. Gregory, pp. 585-675. Elsevier, San Diego, CA.

Lynch, M. 2006. Streamlining and simplification of microbial genome architecture. Annual Review of Microbiology 60: 327-349.

Lynch, M. 2007. The Origins of Genome Architecture. Sinauer Associates, Sunderland, MA.

See also